Open Access
Fig. 1
Download original image
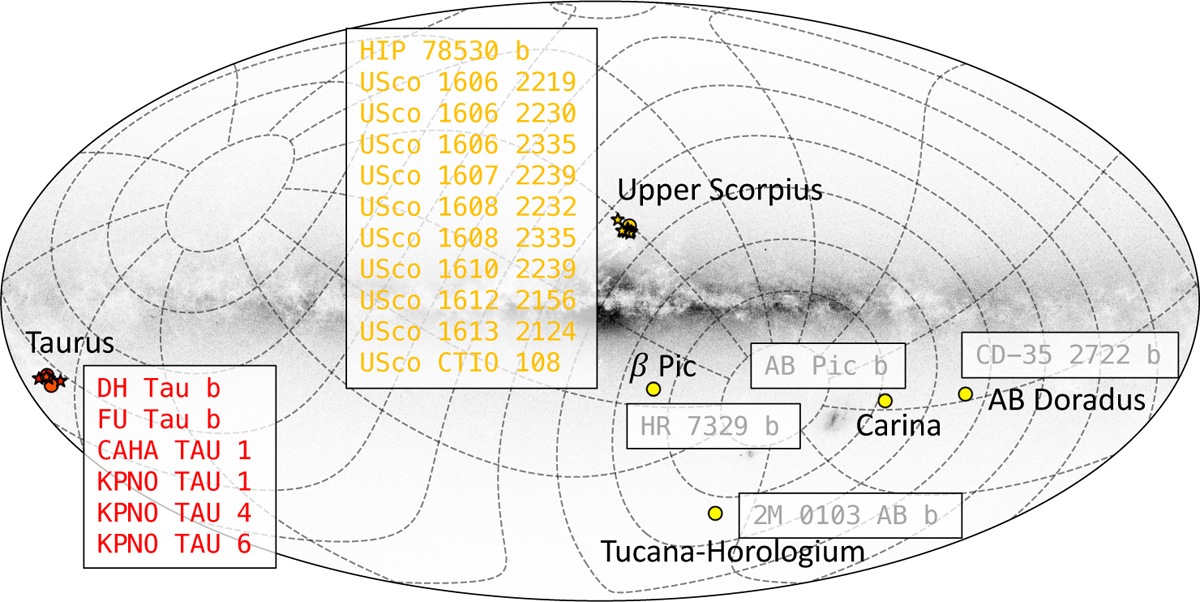
Sky map showing the right ascension and declination curves, along with our 21 targets. The circle marks represent companions, while the star marks indicate isolated objects. The names of the different associations are indicated in black.
Current usage metrics show cumulative count of Article Views (full-text article views including HTML views, PDF and ePub downloads, according to the available data) and Abstracts Views on Vision4Press platform.
Data correspond to usage on the plateform after 2015. The current usage metrics is available 48-96 hours after online publication and is updated daily on week days.
Initial download of the metrics may take a while.