Fig. 3
Download original image
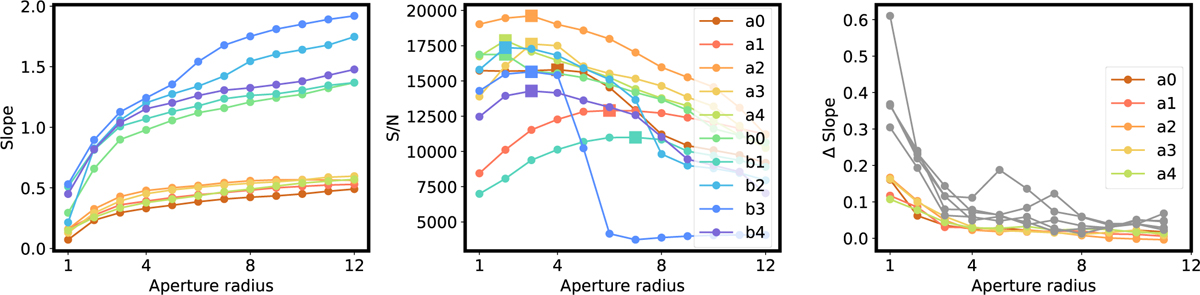
Example of optimal aperture radius selection and spectra rejection criteria using the AB Pic b dataset. In each panel, each color represents a different exposure of AB Pic b. Left: values for the fitted continuum slope between 2.05 and 2.2 µm as a function of aperture radius. Two distinct domains are observed: for radii smaller than the optimal value, the slope increases steeply; for radii larger than the optimal value, the slope still varies but becomes more stable. Center: S/N estimated within the same wavelength range as in the left panel, plotted as a function of aperture radius. For each observation, we highlighted the maximum S/N value with a square. The aperture radius corresponding to this maximum is our final selected radius each time. Right: derivative of the slope (reported in the left panel) with respect to the aperture radius. Some targets exhibit a non-smooth, decreasing derivative; we reject those epochs. For AB Pic b, this resulted in the rejection of the entire dataset for the second night.
Current usage metrics show cumulative count of Article Views (full-text article views including HTML views, PDF and ePub downloads, according to the available data) and Abstracts Views on Vision4Press platform.
Data correspond to usage on the plateform after 2015. The current usage metrics is available 48-96 hours after online publication and is updated daily on week days.
Initial download of the metrics may take a while.