Fig. 4
Download original image
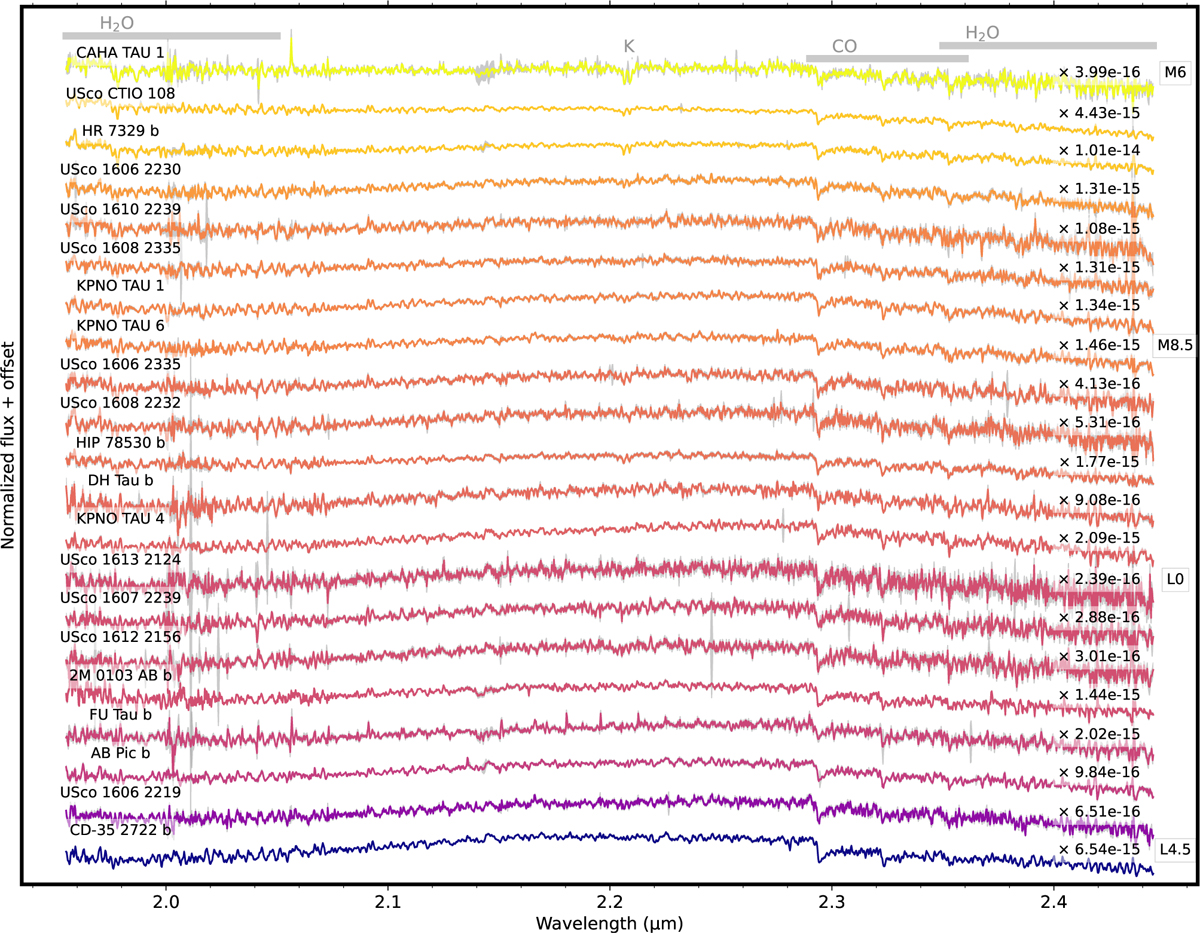
Final extracted spectra for each of the 21 targets in the sample, organized and colored by their spectral type reported in the literature (see Table A.3). The errors are reported in gray, and the main absorption features are labeled at the top of the figure, also in gray. On the right, we annotate the flux scaling factor for each target in units of W m−2 µm−1, also reported in Table A.3.
Current usage metrics show cumulative count of Article Views (full-text article views including HTML views, PDF and ePub downloads, according to the available data) and Abstracts Views on Vision4Press platform.
Data correspond to usage on the plateform after 2015. The current usage metrics is available 48-96 hours after online publication and is updated daily on week days.
Initial download of the metrics may take a while.