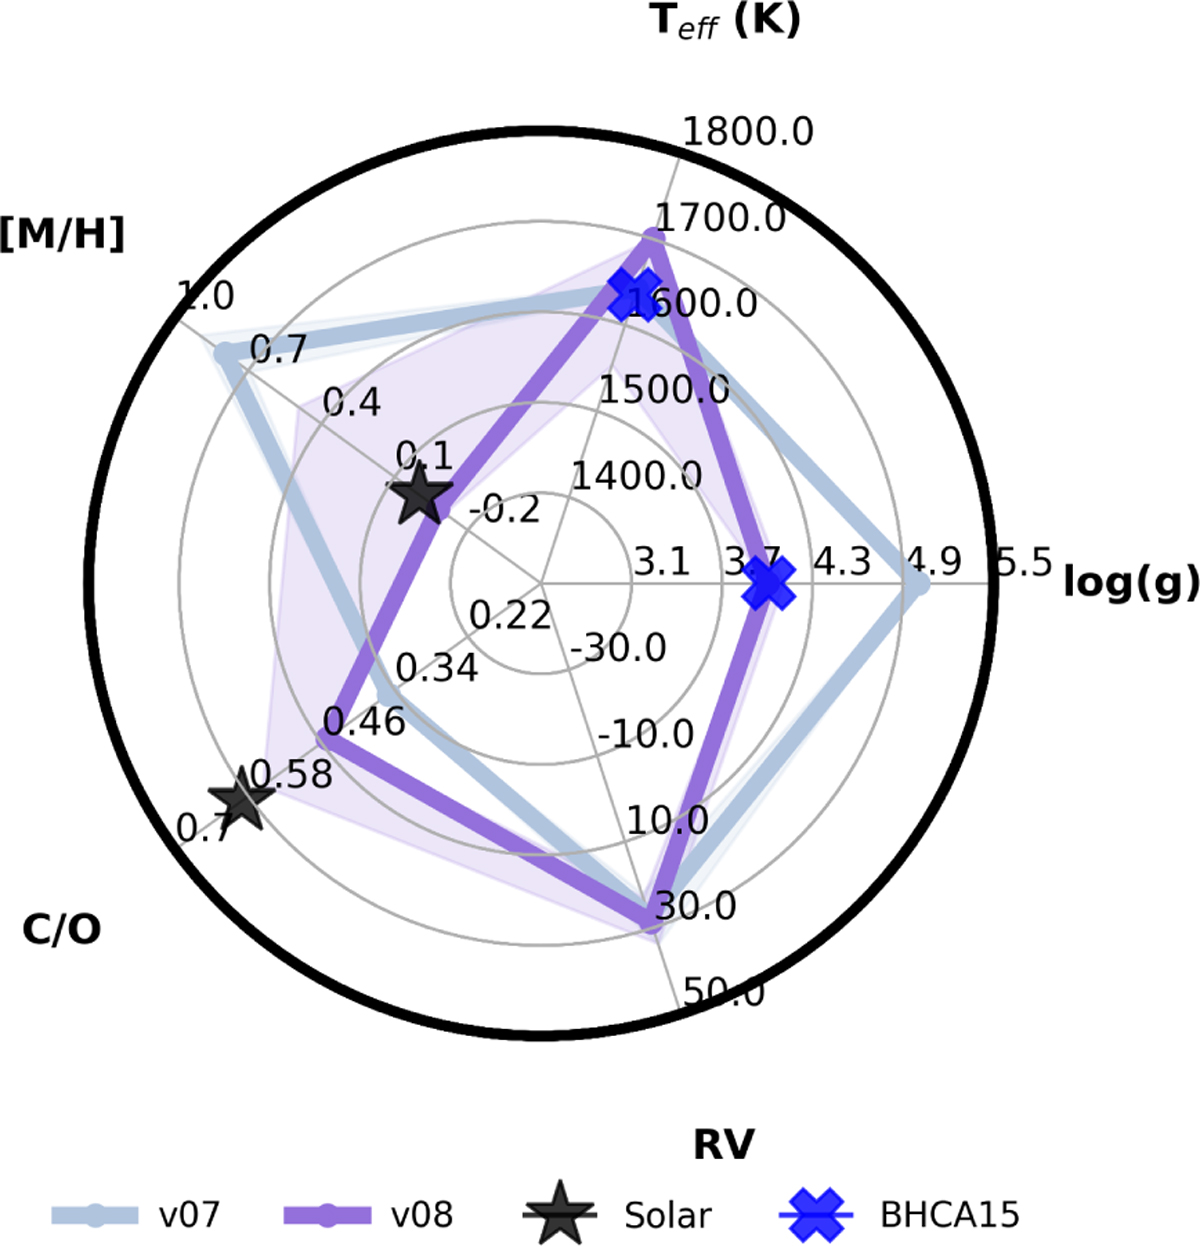
Fig. 6
Download original image
Comparison of the posterior distributions using a uniform versus Gaussian prior on log (ɡ) for AB Pic b (v07 vs. v08 model predictions, shown in light blue and purple, respectively). The Gaussian prior mean value is marked with a blue cross on the log (ɡ) axis, based on the BHAC15 and COND03 evolutionary model predictions. We also marked the Teff predictions with a blue cross, although this was not used as prior information. For comparison, the solar values for [M/H] and the C/O ratio are shown as black stars.
Current usage metrics show cumulative count of Article Views (full-text article views including HTML views, PDF and ePub downloads, according to the available data) and Abstracts Views on Vision4Press platform.
Data correspond to usage on the plateform after 2015. The current usage metrics is available 48-96 hours after online publication and is updated daily on week days.
Initial download of the metrics may take a while.