Fig. 7
Download original image
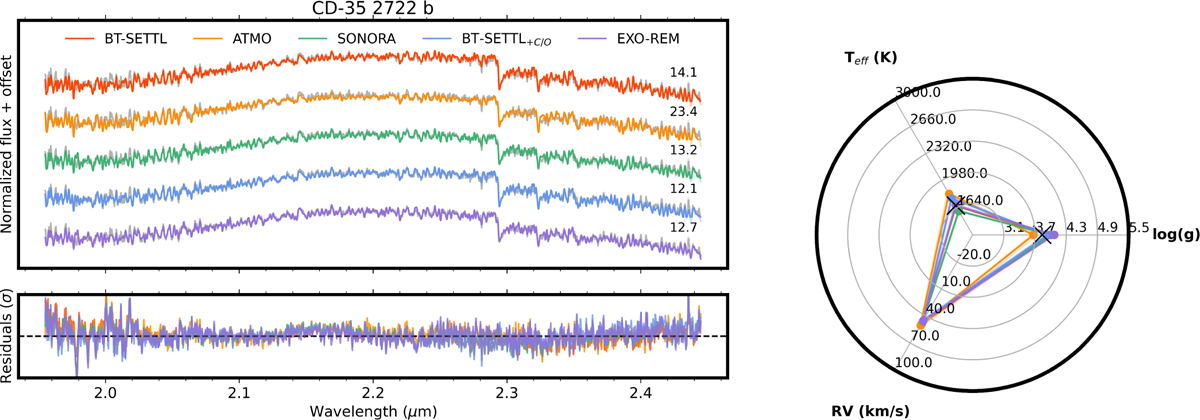
Best-fit results from each atmospheric grid using the setup of run v07 for the companion CD-35 2722 b. On the left, we display the observed spectrum (black) and the best-fit models from each grid in the different colors, offset vertically for clarity. The ![]() values for each fit are shown on the right, on top of each model fit. The bottom-left panel shows the residuals of each fit. On the right, a spider plot compares the derived posterior values among the grids, with the light-colored area representing 99.73% confidence intervals on the posteriors. For this target, all grids except ATMO perform similarly in terms of
values for each fit are shown on the right, on top of each model fit. The bottom-left panel shows the residuals of each fit. On the right, a spider plot compares the derived posterior values among the grids, with the light-colored area representing 99.73% confidence intervals on the posteriors. For this target, all grids except ATMO perform similarly in terms of ![]() and best posterior values. The Teff values are consistent at approximately 1650 K, while log (ɡ) varies between 4.0 and 4.3 dex.
and best posterior values. The Teff values are consistent at approximately 1650 K, while log (ɡ) varies between 4.0 and 4.3 dex.
Current usage metrics show cumulative count of Article Views (full-text article views including HTML views, PDF and ePub downloads, according to the available data) and Abstracts Views on Vision4Press platform.
Data correspond to usage on the plateform after 2015. The current usage metrics is available 48-96 hours after online publication and is updated daily on week days.
Initial download of the metrics may take a while.