Fig. 8
Download original image
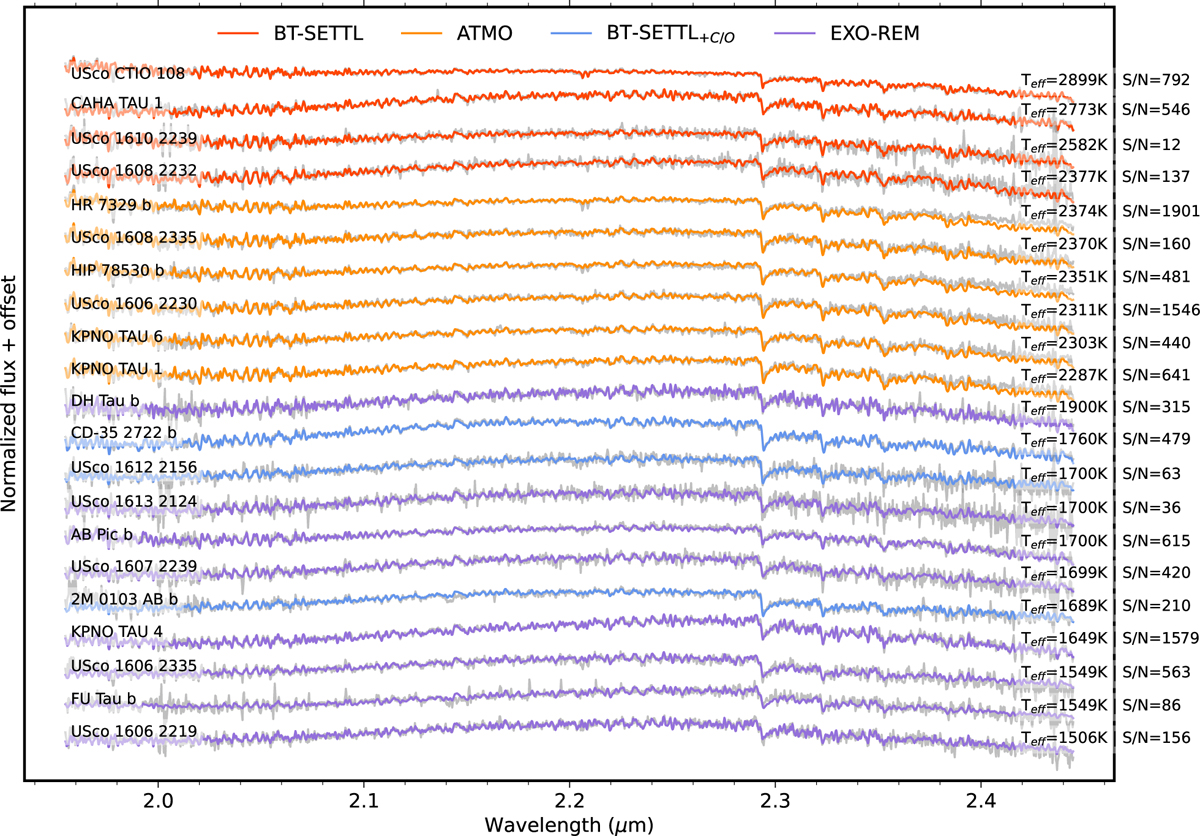
Best spectral fit for each target. Here, the targets are organized by their derived Teff, from hottest at the top to coldest at the bottom. The Teff and S/N values are shown on the right side of each spectrum. The models are color-coded to indicate the grid that provided the best match to the data, selected based on the lowest ![]() value.
value.
Current usage metrics show cumulative count of Article Views (full-text article views including HTML views, PDF and ePub downloads, according to the available data) and Abstracts Views on Vision4Press platform.
Data correspond to usage on the plateform after 2015. The current usage metrics is available 48-96 hours after online publication and is updated daily on week days.
Initial download of the metrics may take a while.