Fig. 9
Download original image
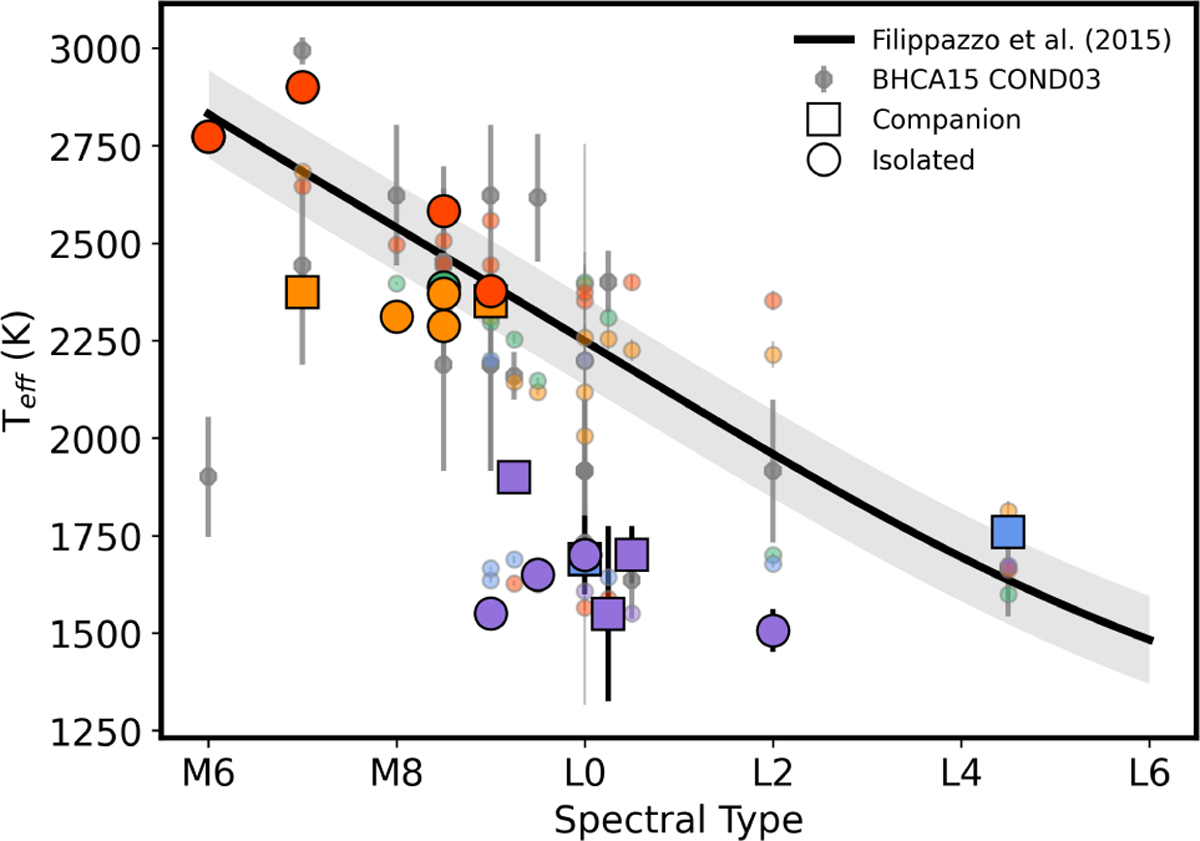
Spectral type vs. Teff comparison. Large markers represent the best-model Teff values, presented in Figure 8. Smaller markers indicate the Teff solutions from all other grids, and gray points show the Teff predictions from evolutionary models. Companions in our sample are highlighted with square markers, and isolated targets are marked with circles. The black curve and gray area represent the relationship determined by Filippazzo et al. (2015) for field brown dwarfs.
Current usage metrics show cumulative count of Article Views (full-text article views including HTML views, PDF and ePub downloads, according to the available data) and Abstracts Views on Vision4Press platform.
Data correspond to usage on the plateform after 2015. The current usage metrics is available 48-96 hours after online publication and is updated daily on week days.
Initial download of the metrics may take a while.