Fig. 10
Download original image
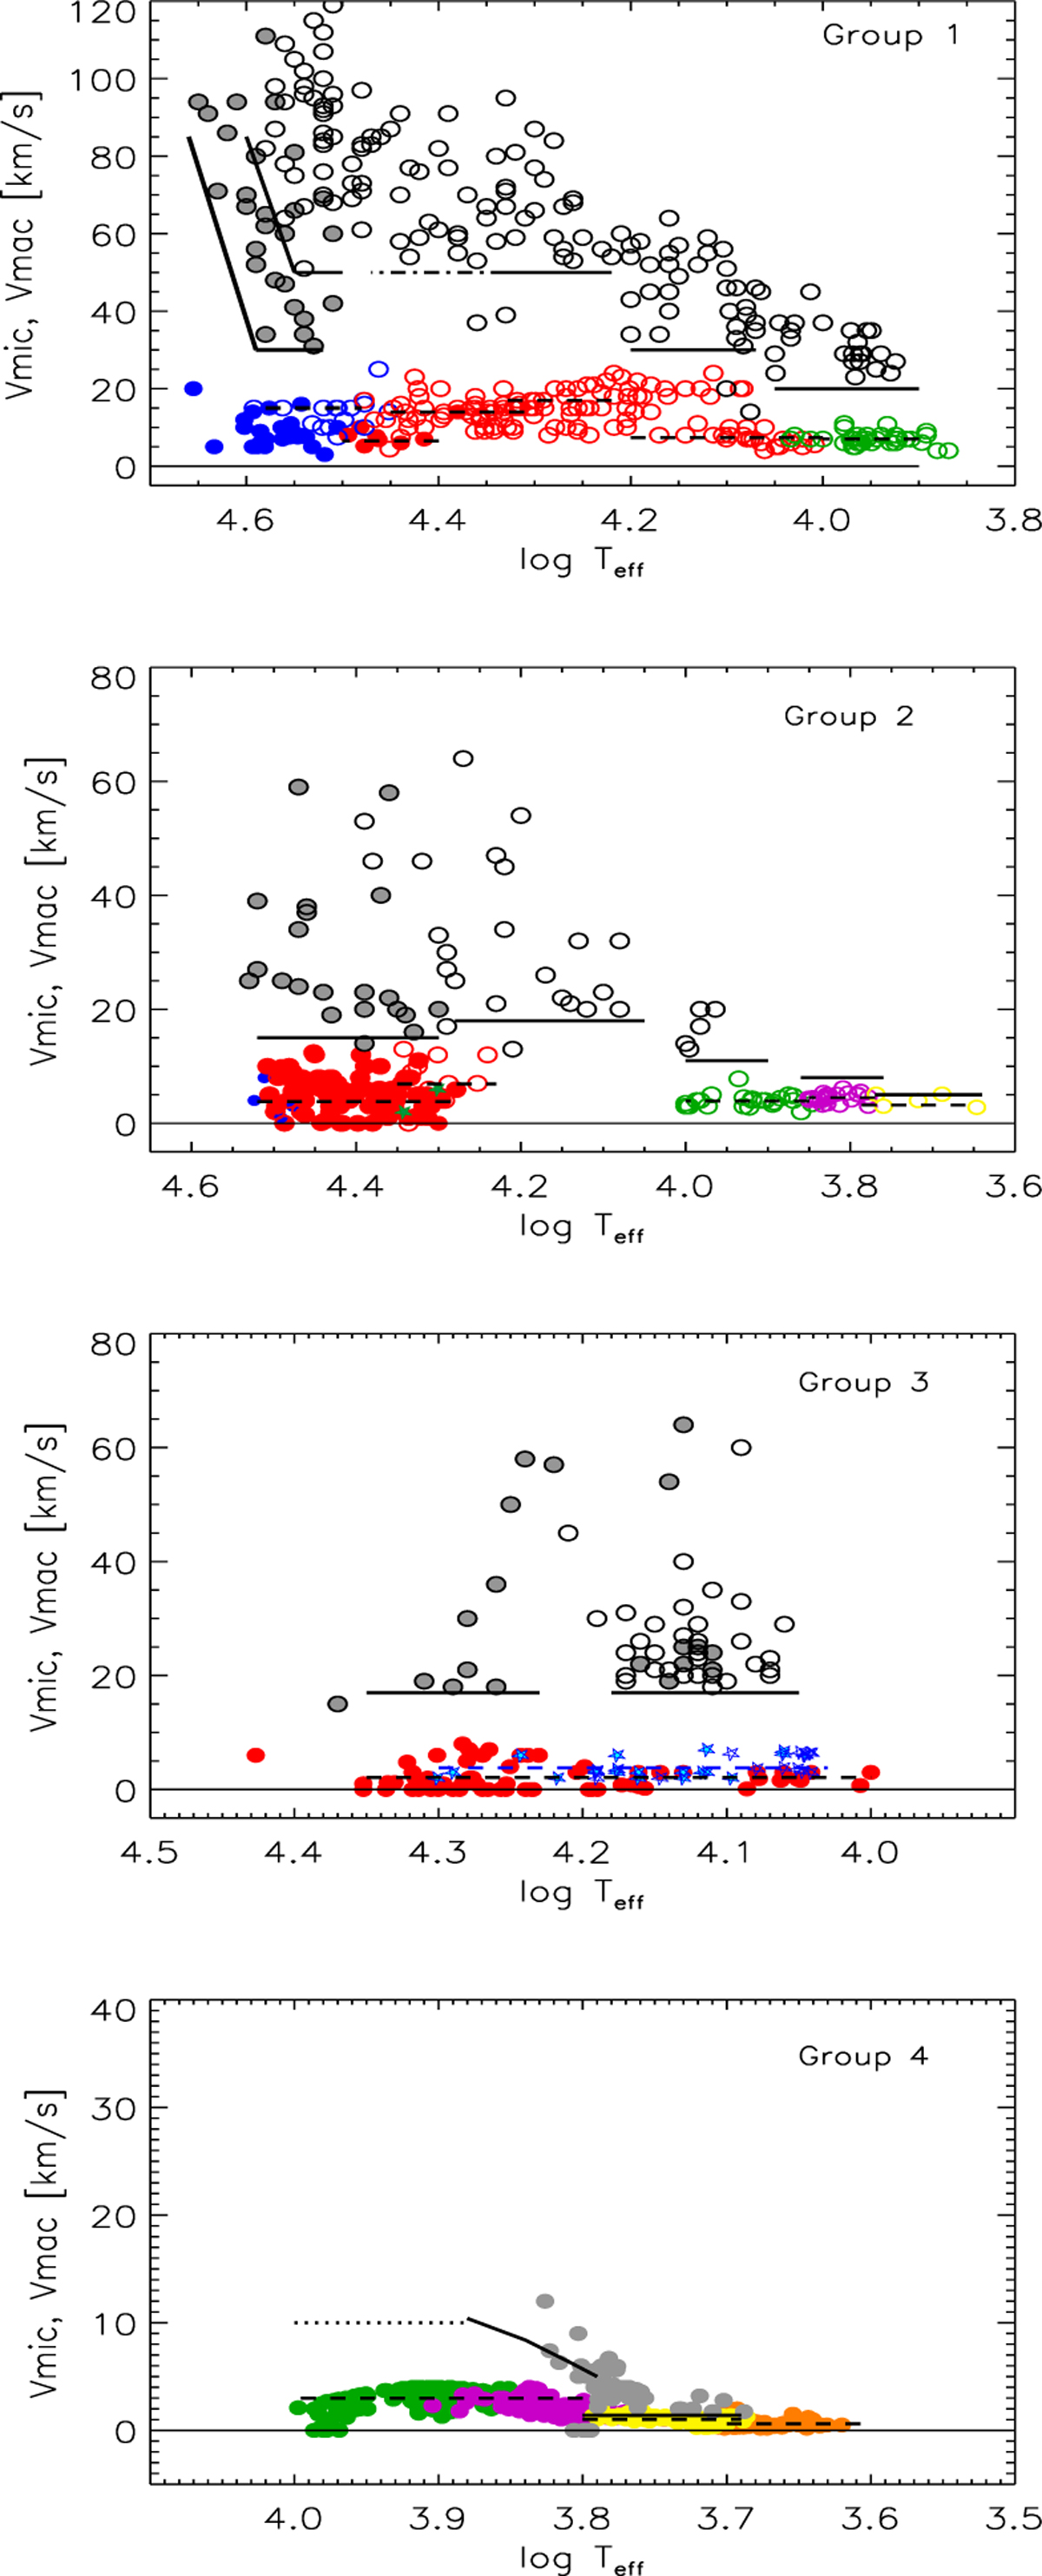
Micro-turbulent velocity of the sample stars, separated by spectral luminosity (Gr. 1 to 4), and by SpT and LC as a function of Teff (same symbols and colours as in Fig. 3). Overplotted in gray are the adopted vmac data with solid and open circles representing LC V/IV and LC III/I objects, respectively. The mean value of the upper detectability limit to vmac averaged ’by eye’ and the corresponding ![]() are also provided to guide the eye (horizontal solid and dashed lines, respectively). In the bottom panel the solid curved line indicates the vmac–Teff calibration provided by Gray (1984). For more information, see the text.
are also provided to guide the eye (horizontal solid and dashed lines, respectively). In the bottom panel the solid curved line indicates the vmac–Teff calibration provided by Gray (1984). For more information, see the text.
Current usage metrics show cumulative count of Article Views (full-text article views including HTML views, PDF and ePub downloads, according to the available data) and Abstracts Views on Vision4Press platform.
Data correspond to usage on the plateform after 2015. The current usage metrics is available 48-96 hours after online publication and is updated daily on week days.
Initial download of the metrics may take a while.