| Issue |
A&A
Volume 701, September 2025
|
|
|---|---|---|
| Article Number | A297 | |
| Number of page(s) | 22 | |
| Section | Stellar atmospheres | |
| DOI | https://doi.org/10.1051/0004-6361/202554907 | |
| Published online | 30 September 2025 | |
Microturbulence across the Hertzsprung–Russell Diagram
Setting observational constraints on Milky Way stars
1
Institute of Astronomy, National Astronomical Observatory, Bulgarian Academy of Sciences,
PO Box 136,
4700
Smolyan,
Bulgaria
2
Center for Computational Astrophysics, Flatiron Institute,
162 5th Avenue,
New York,
NY
10010,
USA
3
Department of Astrophysical Sciences, Princeton University,
Princeton,
NJ
08544,
USA
4
The Argelander Institute for Astronomy,
Auf dem Hugel 71,
53121
Bonn,
Germany
★ Corresponding author: This email address is being protected from spambots. You need JavaScript enabled to view it.
Received:
31
March
2025
Accepted:
27
July
2025
Abstract
Context. Despite its critical importance for determining stellar properties and evolution, the origin and physical nature of microturbulence remains poorly understood. Most of the existing works are focussed on specific spectral types and luminosity classes. However, a comprehensive, unified view has yet to emerge.
Aims. Our main goal is to investigate the behaviour of photospheric micro-turbulence across the Hertzsprung–Russell diagram (HRD) and to bridge theory with observations.
Methods. We assembled a homogeneous database of precise and consistent determinations of effective temperature, surface gravity, projected rotational rate (v sin i), and macro- and micro-turbulent velocities (vmac & vmic) for over 1800 Galactic stars spanning spectral types O to K and luminosity classes I to V. By carefully minimising biases due to target selection, data quality, and disparate analysis techniques, we performed statistical tests and comparative analyses to probe potential dependencies between these parameters and vmic.
Results. Our findings indicate that photospheric micro-turbulence is a genuine physical phenomenon, rather than a modelling artefact. A direct comparison between observed vmic velocities and corresponding theoretical predictions for the turbulent pressure fraction strongly suggests that this phenomenon most likely arises from photospheric motions driven (directly or indirectly) by envelope convection zones, with an additional pulsational component likely operating in main sequence B stars. We show that neglecting micro-turbulence in Fourier transform analyses can partly (but not solely) explain the dearth of slow rotators and the scarcity of stars with extremely low vmac. We argue that including micro-turbulent pressure in atmospheric modelling can significantly mitigate (and even resolve) the mass discrepancy for less massive O stars.
Conclusions. We provide new observational insights into the nature and origin of micro-turbulence across the HRD. Our database offers a valuable resource for testing and refining theoretical scenarios, particularly those addressing a range of puzzling phenomena in hot, massive stars.
Key words: stars: abundances / stars: atmospheres / stars: fundamental parameters
© The Authors 2025
 Open Access article, published by EDP Sciences, under the terms of the Creative Commons Attribution License (https://creativecommons.org/licenses/by/4.0), which permits unrestricted use, distribution, and reproduction in any medium, provided the original work is properly cited.
This article is published in open access under the Subscribe to Open model. This email address is being protected from spambots. You need JavaScript enabled to view it. to support open access publication.
1 Introduction
Micro-turbulence (vmic) is a key parameter in one-dimensional (1D) model atmosphere analyses of stellar spectra. Due to its influence on non-local thermodynamic equilibrium (NLTE) occupation numbers (and, hence, the atmospheric structure) and on formal integral calculations – primarily of metal lines, but also of He I (Smith & Howarth 1998; McErlean et al. 1999; Massey et al. 2013; Markova et al. 2020), – this quantity is frequently introduced as a free parameter (particularly in the O-star regime) to achieve better agreement between model predictions and observations. However, this practice might introduce uncertainties in empirically derived stellar properties, carrying significant implications for our understanding of stellar physics and evolution (e.g. Rivero González et al. 2012; Markova et al. 2014, 2018, 2020).
Despite some unresolved issues (Mucciarelli et al. 2011), the prevailing interpretation of micro-turbulence is that it represents non-thermal velocity fields in stellar atmospheres on scales that are shorter than the photon mean-free path. Consequently, in hot massive stars whose atmospheres are dominated by radiation pressure, micro-turbulent broadening has often been considered an artefact resulting from imperfect modelling of physical processes in stellar atmospheres. These are related to macroscopic velocity fields within extended atmospheres (Kudritzki 1992), deviations from local thermodynamic equilibrium (LTE) in line formation calculations used as diagnostics for vmic (Przybilla et al. 2001, 2006), stellar pulsations (Townsend et al. 2007), or the presence of subsurface convection zones (Cantiello et al. 2009; Grassitelli et al. 2015a,b).
Conversely, in low-mass stars with atmospheres that are partially or predominantly convective, the physical reality of photospheric micro-turbulence is difficult to dismiss. Empirical (Edmunds 1978) and theoretical (Asplund et al. 2000a,b) evidence suggests that in these stars, micro-turbulent broadening is primarily related to convective processes that are not accounted for in standard 1D model atmosphere calculations.
Thus, despite its crucial role in determining stellar properties and evolution, the origin and physical nature of micro-turbulence remain poorly understood. Existing studies have typically concentrated on specific spectral types (SpT) and luminosity classes (LC), lacking a unified global perspective. To address this gap, we initiated a project aimed at providing a comprehensive and statistically significant overview of the empirical properties of photospheric micro-turbulence across a diverse range of Galactic objects. In this paper, we present and discuss the main results of this project.
2 Data collection
2.1 Issues and strategy
An important consideration when compiling and merging multiple data-sets from various literature sources is that these sources can differ significantly in terms of target selection criteria, data quality, and the methodologies employed to determine stellar properties. Consequently, any consolidated dataset of literature Teff, log g, and vmic values necessary for our analysis will inherently be susceptible to various biases. Some of these biases can affect the precision of our analysis, while others could impact the overall accuracy and reliability of our final results.
To ensure a certain degree of consistency among the datasets collected from the literature, we developed and implemented the following strategy:
- (1)
To minimize potential biases and simplify our analysis, we restricted our study to (presumably) single pulsating and non-pulsating stars spanning various evolutionary stages from the main sequence (MS) to the red giant and supergiant phases1. We aimed to maintain a balanced representation across various SpT and LC, thereby achieving comprehensive coverage of the spectroscopic Hertzsprung-Russell diagram (sHRD; Langer & Kudritztki 2014)2.
- (2)
To address observational biases, we exclusively considered studies utilising high-resolution photometric and spectroscopic observations with high signal-to-noise ratios.
- (3)
To mitigate methodological discrepancies, we prioritised Teff, log g, and vmic values derived from proven methods known to deliver accurate and reliable results. We specifically selected methodologies that are mutually consistent and show minimal systematic discrepancies between them3.
While the first two criteria were relatively straightforward to meet, the third criterion proved more challenging because: (i) Teff and log g for most stars are not directly measurable but originate from model-dependent methods and approaches and (ii) stellar physics strongly depends on the initial mass (Minit) and evolutionary stage, necessitating various specialised model atmospheres and line-formation codes tailored for specific mass and temperature regimes, as well as wavelength ranges.
To overcome this issue, we conducted an extensive review of the literature to identify state-of-the-art model atmosphere and line-formation codes as well as analytical techniques frequently employed for specific stellar types (and thus considered credible). We note that although three-dimensional (3D) radiative hydrodynamic model atmospheres and spectra are available (e.g. Husser et al. 2013), we opted to use one-dimensional models exclusively for consistency. Similarly, for consistency, we limit our analysis to optical (or combined UV/optical) data (see the next section).
2.2 Model atmosphere and line formation codes
From the extensive array of model atmosphere and line-formation tools available for determining stellar properties (see Sander 2017 for hot massive stars and Jofre et al 2019 for low-mass stars), we selected the methods listed in Table B.1 as sufficiently robust for populating our database.
Specifically, for massive stars with strong winds (OB and early A-type supergiants), we relied exclusively on data generated by FASTWIND (FW) and CMFGEN, both of which consistently account for UV line-blocking and blanketing and significant departures from local thermodynamic equilibrium (LTE). For stars with weaker or negligible winds, we preferred a combined approach involving non-LTE (NLTE) line formation calculations (SYNSPEC or DETAIL/SURFACE) built upon NLTE (TLUSTY) or LTE (ATLAS9) hydrostatic, plane-parallel, line-blanketed model atmospheres. This approach has demonstrated reliability comparable to purely NLTE analyses (Dufton et al. 2005; Przybilla et al. 2006; Nieva & Przybilla 2007), making it our primary choice for late-O and B-type dwarfs and less luminous AF supergiants.
Finally, for low-mass stars (giants and supergiants with log g <2 dex apart; see Heiter & Eriksson 2006), whose physical conditions are generally well-represented by LTE, hydrostatic equilibrium, and plane-parallel geometry, we primarily utilised the LTE codes ATLAS9 and MARCS combined with various LTE radiative transfer tools. These methodologies were considered reliable sources for our investigation (see Sect. 3.2 for further details).
2.3 Analysis techniques to determine stellar temperatures and gravities
To ensure a meaningful vmic analysis, the literature datasets employed must not only be accurate and reliable, but also precise. Since precision depends not only on observational quality, but also on the analytical techniques used, we selected six of the most widely adopted methods from the literature (for a comprehensive review, see Smalley 2005). These methods, considered sufficiently precise and trustworthy within their respective ranges of applicability, include three techniques employed in spectroscopic analyses and three used in photometric analyses.
2.3.1 Spectroscopic techniques
The two most commonly used spectroscopic techniques for determining Teff and log g in various stellar types (excluding classical Cepheids, see below) are the global line profile fitting (LPF) approach and the method based on fitting equivalent widths (EWs). Both methods were considered in our analysis, with the LPF approach preferred for high-mass stars, where both the line strength and profile shape provide essential diagnostics, and the EW method predominantly employed for lower-mass stars (column 5 in Table B.3).
For classical Cepheid, whose temperatures and surface gravities vary significantly during their pulsation cycles, a specialised approach combining empirical calibrations of line-depth ratios (LDRs) for determining Teff, along with a comparison between observed and synthetic EWs for estimating log g and vmic, has proven more suitable. This combined approach, hereafter referred to as the ‘LDRs/EW approach’, is the method we adopted for collecting the data necessary to analyse the vmic properties of classical Cepheids.
2.3.2 Photometric techniques
Although the optimal method to determine photospheric parameters for a given type of star is through consistent spectroscopy and methodology, accurate and precise values for Teff, log g, and vmic can also be reliably derived from photometric observations. To enhance the statistical robustness of our analysis, particularly for low-mass stars, we selected three photometric techniques considered sufficiently accurate and reliable for inclusion in our database (see Table B.2). Specific information on these methods and their applicability ranges are summarised below. Additional details can be found in Smalley (2005).
•[M1] Teff and log g derived from comparisons between predicted and observed reddening-free Johnson Q and/or Strömgren [c1] and β indices4. Due to the negligible Balmer discontinuity and nearly degenerate UBV intrinsic colours in hot massive stars, this technique is reliable primarily for mid-to-late B-type dwarfs and cooler stars.
•[M2] Teff, log g, and vmic determined by fitting synthetic fluxes to de-reddened spectral energy distributions (SEDs) combined with distance measurements from Hipparchus and Gaia parallaxes. This method is effective only for stars whose SEDs is not affected by wind effects and, thus, can be accurately modelled using five parameters (Teff, stellar radius, R, vmic, metallicity, and interstellar reddening). Finally, log g is constrained from the derived temperature and radius (Gray et al. 2001).
•[M3] Teff obtained from calibrations of photometric colours; log g derived either by fitting synthetic to observed Balmer and metal lines [M3a] or from absolute bolometric magnitudes [M3b]. Since available photometric calibrations generally rely on flux distributions from LTE, line-blanketed Kurucz (1979, 1991) model atmospheres5, this method is primarily applicable to low-mass stars (Luck 2018a; Ivanyuk et al. 2017), massive stars with weak or negligible winds (Daflon et al. 1999, 2001; Smartt et al. 2002), and red giants (Wang et al. 2017).
2.4 Micro-turbulent velocity determinations
Although very precise and unrestricted in terms of Teff and log g, the classical method for determining photospheric microturbulence – eliminating trends between derived abundances and equivalent widths of metal lines from a particular ion – is highly model-dependent. Consequently, this approach can lead to substantial systematic differences between estimates derived using LTE versus NLTE analyses (Kilian 1994; Vranken et al. 2000; Przybilla et al. 2006)6.
To mitigate this issue, we adopted a twofold strategy. For hot, massive stars, where NLTE effects are critical, we selected studies utilising NLTE line formation calculations (at least for the key diagnostic lines) combined with Si III lines as a main vmic indicator7; for cooler and lower-mass stars, we relied on scientific studies using LTE calculations paired with vmic diagnostics that are less sensitive to NLTE effects (typically lines of Fe I, but also of Fe II, Mg II, and Ti II; see, e.g., Schiller & Przybilla 2008; Przybilla et al. 2001; Luck 2018a,b; Ivanyuk et al. 2017). The details are summarised in Columns 6 and 3 of Tables B.2 and B.3.
3 The sample and the database
Following the strategy detailed in the previous section, we compiled a comprehensive database containing Teff, log g, and vmic determinations for over 1800 presumably single Galactic stars, spanning various spectroscopic characteristics and pulsational properties8. An overview of these stars categorised by spectral type and luminosity class, along with specific methodological details and references to the corresponding analyses, are presented in Tables B.2 and B.3. To enhance the statistical coverage, we also included Teff, log g, and vmic determinations from Kilian et al. (1991); Kilian (1994); Kilian et al. (1994), and Lehmann et al. (2011) for a limited number of late-O to early-A type dwarfs and giants, even though these studies employed nonstandard model atmospheres and line-formation codes. Additionally, to maintain balanced representation across various SpT and LC, not all stars analysed in each study were necessarily included in our database (see Section 2.1).
3.1 Completeness and biases
The distribution of stars in our sample by spectral type and luminosity class is illustrated in Fig. 1, with shaded regions indicating the number of objects for which photometric Teff and log g determinations are available. Non-pulsating and pulsating stars are displayed separately (upper and lower panels, respectively). Pulsating stars constitute approximately 20% of the total sample and include four categories of non-radial pulsators: slowly pulsating B-stars (SPBs), β Cephei, γ Doradus, and δ Scuti variables; as well as one category of radial pulsators (classical Cepheids). Additionally, a substantial number of red giants and supergiants (RGs/SGs), representing the advanced stages of stellar evolution toward the red portion of the HRD have been included for completeness.
Fig. 1 shows that, overall, the balance among various luminosity classes is relatively good, with pulsating and non-pulsating LC V/IV stars (highlighted in red) comprising nearly half of the entire sample. However, the distribution by spectral type is more heterogeneous: O-type stars appear underrepresented, A-type stars of LC III are nearly absent, and FGK-type stars (including classical Cepheids and RGs/SGs) dominate, constituting about 63% of the total sample.
These observations might suggest that our observational dataset could be under-representative in the regime of more massive stars. However, this concern is mitigated by a visual comparison of the sHRD in Fig. 2 with similar diagrams from Castro et al. (2014) and Holgado et al. (2020). Such comparisons clearly show that our diagram qualitatively matches those from the cited studies, accurately capturing essential features such as the main and terminal-age main sequences, the Cepheid instability strip, the observed upper boundary of ℒ/ℒ⊙, and indications of the Humphreys-Davidson limit (Humphreys & Davidson 1979). One notable exception is the somewhat under-represented red supergiant (RSG) branch. Moreover, all diagrams consistently reveal a sparsely populated region in the top-left corner, where the most massive and unevolved O-stars typically reside. While this characteristic is well documented (Markova et al. 2014; Massey et al. 2016; Holgado et al. 2020; Simón-Díaz 2020; Castro et al. 2021), it appears more pronounced in our dataset due to the limited availability of reliable vmic diagnostics in optical spectra for O-stars.
The observed deficiency of LC III A-type stars in our sample is also readily explainable. Their location on the sHRD corresponds to the well-known Hertzsprung gap, an evolutionary stage characterised by rapid stellar evolution, resulting in very few observable stars within this region.
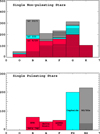 |
Fig. 1 Distribution of the sample stars by spectral type and luminosity class (LC V/IV – red; LC III – light blue; LC II/I – grey) and by the type of pulsations. Upper panel: non pulsating stars. Lower panel: sample pulsators. In both cases the shaded areas indicate the number of objects with photometric Teff and log g determinations. |
3.2 Accuracy and internal consistency
From Column 7 of Table B.3, it appears that the accuracy of the spectroscopic Teff, log g and vmic determination in our database is reasonably good with typical error for low-mass stars somewhat smaller (higher accuracy) than for the high mass ones: ΔTeff between ±0.05 and ±0.10 kK vs. ΔTeff between ±0.2 and ±1.0 kK; Δlog g between ±0.1 and ±0.3 dex, and Δvmic between ±0.04 and ±0.50 km s−1 vs. Δvmic between ±1.0 km s−1 and ±5.0 km s−1. The accuracy of the photometric Teff and log g is also good with 0.08 kK≲ ΔTeff ≲1.2 kK and 0.1 dex≲ 0.1Δlog g ≲ 0.3 dex (see Column 6 of Table B.2).
While these results are most likely a consequence of our data selection strategy (Sect. 2), we must bare in mind that in some cases (bold-faced numbers in Tables B.2 and B.3) the error provided by the corresponding authors represents the precision rather than the total accuracy of the obtained estimates and must be therefore considered as an upper limit.
Regarding the internal consistency of the adopted datasets, controlling this factor is challenging due to the variety of literature sources involved. Nevertheless, substantial theoretical and observational evidence supports the following conclusions:
The internal consistency among the methodologies and datasets underpinning our analysis is generally robust, with discrepancies typically on the order of the associated uncertainties (see, e.g., Puls et al. 2005; Martins et al. 2005b; Rivero González et al. 2012; Massey et al. 2013; McEvoy et al. 2015; Holgado et al. 2018; Markova et al. 2020 for massive stars, and Daflon et al. 2001; Gustafsson et al 2008; Gebran et al. 2010; Lyubimkov et al. 2015; Ivanyuk et al. 2017 for lower-mass stars).
The overall agreement between photometric and spectroscopic methods employed in our study is also favourable, with systematic offsets comparable to or only slightly exceeding the associated internal uncertainties (Palacios et al. 2016; Cordero et al 2014; Niemczura et al. 2015; Luck 2018a).
In summary, although our database is not statistically complete, it is sufficiently extensive to facilitate a meaningful and realistic analysis of the global vmic properties of Galactic stars.
4 Micro-turbulence as a function of effective temperature and equatorial surface gravity
The vmic properties of the sample stars were investigated by categorising them according to their spectral type (SpT), luminosity class (LC), and type of pulsation. For non-pulsating stars of a given SpT, the Spearman rank correlation test was consistently applied to evaluate the strength (ρ) and significance (p) of potential relationships between vmic and both Teff and log g9. Further details are provided in Sect. 4.1. For the pulsating ones, a somewhat different approach has been applied instead (Section 4.2 and Appendix A).
4.1 Non-pulsating stars: Results by spectral type and luminosity class
In chemical abundance studies, spectral type (SpT) and luminosity class (LC) are frequently (if not always) used as reference points to describe and interpret the vmic properties of the analysed stars. To facilitate direct comparisons with such studies, we began our analysis by examining the behaviour of vmic in non-pulsating sample stars as a function of Teff and log g, separating them by SpT and LC. The key outcomes of this analysis are presented in Fig. 3 and summarised in Table 1. Detailed comments are provided below.
O-type stars. As discussed in Sect. 3.1, the number of O-type stars in our database is relatively small: 50 stars in total, including 29 (58%) of LCV/IV, 15 (30%) of LCII/I, and 6 (12%) of LCIII10. For most of these stars (37), the relevant data were compiled from the literature. For the remaining stars, Teff and log g values were taken from Markova et al. (2018), and vmic was determined by us using He I 6678 as a diagnostic line (see Holgado et al. 2018, Markova et al. 2020, and references therein).
From the top panels of Fig. 3, it appears that photospheric micro-turbulence of the sample O stars (symbols coloured in blue) tends to increase towards lower gravity from generally subsonic (![Mathematical equation: $\[\bar{v}_{\text {mic}}\]$](/articles/aa/full_html/2025/09/aa54907-25/aa54907-25-eq1.png) =8.0±4.1 km s−1) to supersonic (
=8.0±4.1 km s−1) to supersonic (![Mathematical equation: $\[\bar{v}_{\text {mic}}\]$](/articles/aa/full_html/2025/09/aa54907-25/aa54907-25-eq2.png) =14.3±2.8) velocities with a borderline between the two regimes observed at log g ≈3.7 dex (i.e., at the value separating roughly LC V/IV from the LC III/I stars, see Markova et al. 2018). Additionally, a tendency of cooler dwarfs and subdwarfs to appear, on average, less affected by vmic compared to the hotter ones seems to emerge as well. While the former observation has been statistically confirmed, no evidence of any significant correlation between vmic and Teff has been derived (within each of the two LC subgroups or over the complete sample; see the corresponding data in Table 1).
=14.3±2.8) velocities with a borderline between the two regimes observed at log g ≈3.7 dex (i.e., at the value separating roughly LC V/IV from the LC III/I stars, see Markova et al. 2018). Additionally, a tendency of cooler dwarfs and subdwarfs to appear, on average, less affected by vmic compared to the hotter ones seems to emerge as well. While the former observation has been statistically confirmed, no evidence of any significant correlation between vmic and Teff has been derived (within each of the two LC subgroups or over the complete sample; see the corresponding data in Table 1).
There are, at least, two points of potential concerns regarding the above outlined results: first, since our O-star data sets exclusively originate from FW analyses, it may well be that these findings are subjects of systematic uncertainties as reported by Massey et al. (2013); second, due to the general scarcity of more massive O-stars close to the ZAMS (see Sect. 3.1), our findings may not be representative for the complete O star regime.
To deal with the first issue, we contrasted the temperature distribution of micro-turbulent broadening of our O-stars to analogous results for O stars in the Small Magellanic Clouds (SMC) derived by Heap et al. (2006) using the CMFGEN code (in the top panels of Fig. 3, symbols highlighted in pink). While the dependence of vmic on metallicity is still an open issue, the consistency between the two data sets is reasonably good (no evidence of any systematic shifts). This allows us to conclude that the vmic properties of Galactic O-stars derived by us are not likely to be significantly affected by the particular modelling.
Regarding the second issue, from a direct comparison of the log g and Teff ranges covered by our O-star sample to the ones theoretically predicted by Martins et al. (2005a), shown in the top panels of Fig. 3 (the red solid (DWs) and dashed (Gs/SGs) vertical lines) it appears that we have only two objects with logTeff ≳4.6. This result indicates that the vmic properties of Galactic O stars we derived are representative only for objects cooler than ~40 kK only.
B-type stars. The B-star subsample consists of 323 objects of SpT from B0 to B9 distributed by LC as follows: ~49% are of LC V/IV: ~42% – of LC II/I, and 9% – of LC III (see upper panel of Fig. 1).
From the second raw panels of Fig. 3, we see that in spite of the relatively large dispersion at a given Teff and log g (generally ≲2σ measurement error), the behaviour of vmic is not chaotic; rather it follows a number of well defined patterns. Specifically, at 3.70 dex≤log g <4.50 dex, (LC V/IV, solid circles; see Fitzpatrick & Massa 2005; Lefever et al. 2010; Nieva 2013) the typical velocity ranges from zero up to ~12 km s−1 with a tendency to decrease toward a cooler temperature with values indistinguishable from zero at Teff ≤4.2 dex. At 3.30 dex≤log g <3.70 (LC III, black open circles) the photospheric microturbulence is, on average, larger than for the high gravity objects (![Mathematical equation: $\[\bar{v}_{\text {mic}}\]$](/articles/aa/full_html/2025/09/aa54907-25/aa54907-25-eq3.png) = 6.9±4.0 km s−1 vs.
= 6.9±4.0 km s−1 vs. ![Mathematical equation: $\[\bar{v}_{\text {mic}}\]$](/articles/aa/full_html/2025/09/aa54907-25/aa54907-25-eq4.png) = 3.8±3.2 km s−1) and appears to decline towards cooler Teff as well.
= 3.8±3.2 km s−1) and appears to decline towards cooler Teff as well.
Finally, at log g <3.30 dex (LC II/I; red open circles; see Lefever et al. 2007; Markova et al. 2008; Markova & Puls 2008; Searle et al. 2008), two distinct vmic subgroups clearly emerge with a borderline between them seen at log Teff ≈4.10–4.15 dex. On the hotter side, the photospheric micro-turbulence is generally supersonic (>10 km s−1) and tends to increase with decreasing Teff (Group A.1); on the cooler one, it is, on average, subsonic and seems to decrease with decreasing Teff instead (Group A.2). One caveat to note is that due to low statistics, the results obtained for LC III stars and Gr. A. 2 objects should be considered with caution.
AF-type stars. The number of A- and F-type stars in our analysis is 210 and 233, respectively, with LC V/IV objects apparently dominating over the LC III/II/I ones: ~63% vs. ~37%, respectively (upper panel of Fig. 1 and the data listed in Column 3 of Table 1).
From the third raw panels of Fig. 3 it appears that photospheric micro-turbulence of the sample A stars tends to strengthen toward lower gravities. The relationship is found to be moderately strong and significant with LC V/IV objects (log g ≥3.6 dex, solid circles; see e.g. Niemczura et al. 2015) indicating velocities, on average, a factor of two lower that those of LC II/I ones (log g ≤2.4 dex, open circles; e.g. Venn 1995; Verdugo et al. 1999). Although less affected by vmic compared to A-type stars, the sample F-stars (fourth raw panels of Fig. 3) also provide evidence of a strong dependence of this quantity on log g with LC II/I objects (log g ≤2.4 dex, open circles; see Lyubimkov et al. 2010, 2015) having ![Mathematical equation: $\[\bar{v}_{\text {mic}}\]$](/articles/aa/full_html/2025/09/aa54907-25/aa54907-25-eq6.png) a twice higher than that of LC V/IV ones (log g ≥3.6 dex, solid circles; see Niemczura et al. 2015; Takeda et al. 2005b).
a twice higher than that of LC V/IV ones (log g ≥3.6 dex, solid circles; see Niemczura et al. 2015; Takeda et al. 2005b).
Concerning the temperature behaviour of vmic, for AF-type SGs this quantity is temperature independent; for AF-type DWs, however, a weak negative (SpT A) and a very strong positive (F SpT) correlation has been derived in perfect qualitative agreement with previous findings from Gray et al. (2001); Smalley (2004); Takeda et al. (2008); Gebran et al (2014); Niemczura et al. (2015).
GK-type stars. The total number of G-stars in our analysis is 312 with 203 classified of LC V/IV (~65%), 69 – of LC III (~22%), and 40 of LC II/I (~13%). From the fifth raw panels of Fig. 3 we find that also in this temperature regime low-gravity objects (LC II/I, log g ≤2.3 dex, open circles; see Lyubimkov et al. 2010, 2015; Takeda et al. 2005a,b) appear more strongly affected by vmic compared to the high-gravity ones (log g ≥3.5 dex, LC V/IV, solid circles): ![Mathematical equation: $\[\bar{v}_{\text {mic}}\]$](/articles/aa/full_html/2025/09/aa54907-25/aa54907-25-eq7.png) = 3.2±1.4 vs.
= 3.2±1.4 vs. ![Mathematical equation: $\[\bar{v}_{\text {mic}}\]$](/articles/aa/full_html/2025/09/aa54907-25/aa54907-25-eq8.png) = 1.0±0.4 km s−1. Additionally, within each LC subgroup this quantity is strongly correlated with Teff: the stronger vmic– the cooler the stars (Columns 7&8 of Table 1).
= 1.0±0.4 km s−1. Additionally, within each LC subgroup this quantity is strongly correlated with Teff: the stronger vmic– the cooler the stars (Columns 7&8 of Table 1).
Regarding the sample of K-type stars (a total of 106, all of LCV/IV with log g ≥4.10 dex; see sixth-row panels of Fig. 3), although their vmic values are generally low, they are on average significantly different from zero (![Mathematical equation: $\[\bar{v}_{\text {mic}}\]$](/articles/aa/full_html/2025/09/aa54907-25/aa54907-25-eq9.png) =0.6±0.3). Moreover, vmic appears to be independent of both Teff and log g. Due to the narrow log g/logTeff range covered by our dataset, these findings should be interpreted with caution.
=0.6±0.3). Moreover, vmic appears to be independent of both Teff and log g. Due to the narrow log g/logTeff range covered by our dataset, these findings should be interpreted with caution.
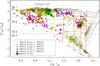 |
Fig. 2 Spectroscopic HRD of the sample stars with data-points colour-coded and size-scaled according to their vmic value, as indicated in the legend. Overplotted, we have the Brott et al. (2011) evolutionary tracks for single stars with solar metallicity and initial rotational velocity Vrot = 300 km s−1; the Eddington limit (horizontal dotted line); the observed HD limit (gray solid thick lines) and the temperature boundaries corresponding to each spectral type (red almost vertical lines). Error bars are omitted for clarity. For more information see Sect. 5. |
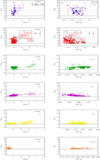 |
Fig. 3 Photospheric micro-turbulence of the sample non-pulsating stars separated by SpT and LC (open circles – LC III/I; solid circles – LC V/IV) as a function of log g (left) and Teff (right). In the top panels over-plotted are: the vmic velocities of a sample of O stars in the SMC derived by means of the CMFGEN code (from Heap et al. 2006), and the theoretical Teff and log g scales of O stars in the MW predicted by Martins et al. (2005a) (red solid (DWs) and dashed (SGs) vertical lines). In each plot, the representative error bars are also indicated. For more information, see Sect. 4. |
Statistical properties of photospheric micro-turbulence of the sample non-pulsating stars separated by SpT and LC.
Statistical properties of photospheric micro-turbulence of the sample non-radial pulsators separated by the type of oscillations and of the classical Cepheids and red giants and supergiants divided into two mass-luminosity subgroups.
4.2 Pulsating stars and objects in the red giant phase
There is both direct and indirect evidence that stellar pulsations arising from coherent gravity (g) or pressure (p) mode oscillations can significantly affect the macro-turbulent velocity (vmac) derived for main sequence B-stars using the Fourier transform (FT) or FT combined with goodness-of-fit (FT+GOF) methods (Aerts et al. 2014; Simón-Díaz et al. 2017, and references therein). In some cases, these modifications can reach amplitudes of several tens of km s−1. Since both the line-profile shapes and line equivalent widths (EWs) are predicted to vary throughout a pulsation cycle (see, e.g., Fig. 7 in Aerts et al. 2014), and our analysis is based entirely on data obtained via line profile fitting (LPF) and EW measurements (Sect. 2.4), it is plausible that such oscillations may influence the observed micro-turbulent velocities.
To explore this possibility, we compiled a database of literature values for Teff, log g, and vmic for approximately 160 Galactic stars identified as p- and g-mode pulsators of various types (β Cephei, slowly pulsating B-stars, γ Doradus, and δ Scuti variables)11. To this sample, we added 199 classical Cepheids (radial pulsators) and 222 red giants and supergiants (RGs/SGs), representing late evolutionary stages on the redwards path of the HRD, for completeness.
The primary results of the vmic analysis for these variable stars are shown in Fig. 4 and summarised in Table 2. Further discussion is provided in Appendix A, where Fig. A.1 shows the location of these stars in the sHRD. Our key findings are highlighted below. We note that for non-radial pulsators (non-RPs), we conducted a comparative analysis against non-pulsating reference stars with similar Teff, log g, and ℒ/ℒ⊙ to assess any differences in vmic behaviour. We also note that due to certain limitations – such as heterogeneity in pulsation types, reliance on snapshot rather than time-series data, limited sample sizes, and incomplete coverage in Teff and log g– these results should be interpreted as indicative rather than conclusive.
• All types of variable stars in our database show photospheric micro-turbulence values that are significant overall; namely above their respective uncertainties (column 10 of Table 2).
• The vmic properties of non-RPs are generally similar to those of the corresponding reference stars, with SPBs as a possible exception (see first to fourth rows of Fig. 4 and columns 7–10 in Table 2). These findings suggest that pulsations are unlikely to play a dominant role in setting vmic in β Cephei, γ Doradus, and δ Scuti stars. However, further investigation is required to determine whether high-order g-mode oscillations in SPBs significantly affect their photospheric EW profiles.
• For classical Cepheids, vmic tends to increase with decreasing Teff and log g (and thus increasing Minit). While this trend is qualitatively consistent with that observed for non-variable stars (Sect. 4), it is not statistically confirmed (see Table 2 and the two horizontal lines in the left fifth-row panel of Fig. 4). This may be due to selection effects and large intrinsic dispersion in vmic at given Teff and log g, likely arising from the combined use of snapshot and phase-averaged data (Proxauf et al 2018; Luck 2018b). A more robust analysis using exclusively phase-averaged data across the entire instability strip is necessary to conclusively determine whether higher-mass Cepheids are more affected by micro-turbulence.
• For red giants, vmic increases with decreasing surface gravity, while red supergiants (RSGs) appear less affected than expected based on their Teff and log g (see red line in the bottom left panel of Fig. 4). These results could indicate that RSGs exhibit different vmic behaviour compared to RGs – a plausible outcome given the significantly different surface conditions of these two stellar groups (see e.g. Goldberg et al. 2020). However, due to the small number of RSGs in our sample, this conclusion remains tentative.
Based on the analyses in this and the previous subsections, two main conclusions emerge: First, for all stars in our sample, regardless of spectroscopic or pulsational characteristics, photospheric micro-turbulence is significant (i.e. above measurement uncertainty). Second, within each SpT, vmic depends meaningfully on Teff and log g, but the relationship lacks a uniform pattern that would allow for a deeper understanding of its origin when studied within a single SpT. These findings caution against neglecting vmic or assuming a fixed, ad hoc value across all stars of a given SpT. Such simplifications may introduce systematic errors into derived chemical abundances, particularly for O-type stars. For example, assuming an ad hoc vmic =10 km s−1 can lead to systematic overestimation of log (N) by ~0.04–0.08 dex (CMFGEN) and ~0.07–0.14 dex (FASTWIND) in supergiants, and an underestimation of similar magnitude in dwarfs – especially toward the cooler end of the temperature regime.
 |
Fig. 4 Photospheric micro-turbulence of the sample non-radial pulsators (separated by the type of oscillations), and of the classical Cepheids and red giants and supergiants (symbols highlighted in light and dark blue, respectively) as a function of log g (left) and Teff (right). For the case of non-RPs analogous results for non-pulsating stars of similar Teff, log g and ℒ/ℒ⊙ (colour-coded as indicated in Fig. 3), are also provided for a direct comparison. In each panel the horizontal dashed lines indicate the upper and lower limits to vmic In the left fifth raw panel, the light and dark blue lines represent the mean vmic, averaged within the subgroups of low- and high-mass Cepheids, respectively; in the bottom left panel, the red line indicates the least square fit to vmic of the sample RGs thereby highlighting the deviation of RSGs from this trend. For more information see Appendix A. |
5 Micro-turbulence across the sHRD
5.1 General features
Despite their overall diverse, the behaviour of vmic across the sample stars exhibits one consistent trend: within each spectral type (SpT), low-gravity stars (LCII/I) show systematically higher micro-turbulent broadening than high-gravity stars (LCV/IV). This pattern, previously hypothesised by Gray et al. (2001), Bouret et al. (2005), Lyubimkov et al. (2010), Holgado et al. (2018), and Markova et al. (2018) based on smaller samples within specific SpTs, suggests that, on a global scale, photospheric micro-turbulence may depend on stellar mass and evolutionary stage.
With this in mind, we constructed a spectroscopic HRD for all sample stars (both pulsating and non-pulsating), where each star is represented by a circle colour-coded and size-scaled according to its corresponding vmic (see legend in Fig. 2). Although it is somewhat patchy (see Sect. 3.1), this vmic map benefits from the large and diverse sample, allowing for the emergence of several notable trends. In particular, the map suggests that photospheric micro-turbulence tends to decrease along a trajectory from the top-left to the bottom-right of the diagram; that is, with decreasing ℒ/ℒ⊙ (=Teff 4/g) and Teff. This trend is supported by the data presented in Fig. 5, which highlight three key findings:
1. Despite significant scatter at fixed ℒ/ℒ⊙ (see below), vmic generally decreases with decreasing spectroscopic luminosity and hence lower initial stellar mass (Minit).
2. At similar ℒ/ℒ⊙ values, stars of different SpT exhibit significantly different vmic values – typically differing by more than 2–3σ (see Column 7 of Tables B.3 and B.2). In general, later-type stars show lower vmic than earlier-type ones. Since later SpTs at a given ℒ/ℒ⊙ correspond to more evolved objects, this finding suggests that micro-turbulence may be influenced not only by Minit but also by the degree of stellar evolution.
3. For stars with log(ℒ/ℒ⊙) ≳ 3.1 dex, a clear upper detectability limit to vmic becomes apparent.
 |
Fig. 5 Photospheric micro-turbulence of the sample stars (pulsating and non-pulsating) as a function of logℒ/ℒ⊙ (=[Teff 4/g]). The data points are colour coded according to their SpT (as indicated in the legend) with slowly pulsating B-stars (SPBs) highlighted in light blue. Vertical lines divide the sample into four spectral luminosity subgroups, depending on the maximum vmic velocity achieved by the corresponding stars (horizontal dotted lines), with the red one indicating the approximate limit between the high and low mass regimes (for more information, see the text). |
5.2 Dependence on stellar initial mass and evolution
To investigate the potential dependence of photospheric microturbulence on initial mass (Minit) and stellar evolution, we adopted a two-step approach. First, to reduce the confounding influence of ℒ/ℒ⊙, we divided the sample into four spectral luminosity subgroups based on the maximum observed vmic values achieved by the corresponding stars (see horizontal dotted lines in Fig. 5). Second, within each luminosity subgroup, we examined the behaviour of vmic as a function of Teff, clearly distinguishing between stars of different SpT, LC, and pulsation types. The main results of this analysis are illustrated in Fig. 6, with detailed commentary provided below.
Group 1 (vmic ≲24 km s−1, 3.4≲log(ℒ/ℒ⊙)≲4.3; roughly corresponding to Minit ≳15M⊙). As seen in the upper left panel of Fig. 6, Group 1 is primarily composed of more massive OBtype stars and their evolutionary descendants, namely luminous AFG-type supergiants. A small number of very luminous classical Cepheids and red supergiants (RSGs) are also present in this group.
While the photospheric micro-turbulence in Group 1 stars appears to depend on temperature, the relationship is nonmonotonic. It begins with a gradual increase from subsonic (vmic ≈5 km s−1) to highly supersonic velocities (vmic ≈25 km s−1) over the range 4.6≲logTeff ≲4.15, followed by a sharp decline to vmic ~10 km s−1 at log Teff ≈4.15 (marked by a solid vertical line), and a more moderate decrease thereafter. Late-B and A-type supergiants are more strongly affected than their more evolved FG-type counterparts (including Cepheids), with average values of 7.4±1.8 km s−1 and 7.0±1.8 km s−1 versus 4.3±0.7 km s−1 and 4.3±1.0 km s−1, respectively. There is suggestive evidence of a further decrease in vmic toward RSGs, though the sample size is too small for firm conclusions.
A noteworthy detail is the potential local minimum in vmic (indicated by a vertical arrow), which is intriguingly close to the location of the bi-stability jump identified by Markova & Puls (2008) at log Teff ≈4.3 dex. This proximity raises the possibility that micro-turbulence in this mass and temperature regime could be influenced, either directly or indirectly, by changes in stellar wind properties.
The sudden drop in vmic at log Teff ≈4.15 may be explained by its proximity to the transition between the horizontal and temperature-dependent segments of the Humphreys-Davidson (HD) limit on the sHRD (Fig. 2, upper panel, dark gray lines). As the HD limit is typically associated with intense mass loss that halts the evolution of stars with Minit ≳25 M⊙ toward cooler temperatures, this context may account for the observed drop. While this hypothesis is supported by the fact that most B-type SGs with vmic ≤10 km s−1 have Minit <20–30 M⊙, the presence of a few outliers with much higher vmic suggests that other contributing factors may also be at play.
Group 2 (vmic ≤14 km s−1, 2.7<log(ℒ/ℒ⊙)≤3.4; Minit ~8–15 M⊙). This subgroup includes a small number of O-type dwarfs, many B-type main sequence (MS) stars (including nearly all β Cephei variables and two SPBs), a large number of massive Cepheids and AFG-type SGs, and a limited number of RSGs. Due to the Hertzsprung gap, we lack post-MS B stars within 4.25≲logTeff ≲4.0 (see Fig. 2).
The upper right panel of Fig. 6 shows that vmic tends to decrease with decreasing Teff (and thus more advanced evolutionary stages). However, this trend is not statistically confirmed. MS B-stars have vmic values comparable to those of evolved AFG-type SGs (including massive Cepheids): average values are 5.7±3.3 km s−1 vs. 3.9±1.1 km s−1, 4.5±0.8 km s−1, and 4.2±1.0 km s−1, respectively. In contrast, RSGs in this group exhibit significantly lower vmic: ![Mathematical equation: $\[\bar{v}_{\text {mic}}\]$](/articles/aa/full_html/2025/09/aa54907-25/aa54907-25-eq11.png) = 1.52±0.27 km s−1, with a potential drop near log Teff =3.65–3.70 dex.
= 1.52±0.27 km s−1, with a potential drop near log Teff =3.65–3.70 dex.
Group 3 (vmic ≤7 km s−1, 1.6 <log(ℒ/ℒ⊙)≤2.7; Minit ~ 3–8 M⊙). Group 3 includes many low-mass B-type dwarfs and SPBs, a limited number of MS A-type stars, numerous post-MS AFGtype objects (including Cepheids), and a large sample of red giants (169 stars)12.
Although it is lower in amplitude than in Group 2, vmic in Group 3 behaves similarly being relatively high and approximately temperature-independent above log Teff ≳3.7 dex. The average values are: 2.11±2.21 km s−1 (B-type dwarfs), 3.83±1.60 km s−1 (SPBs), 3.25±0.46 km s−1 (A-type), 3.49±0.52 km s−1 (F-type), and 4.0±0.8 km s−1 (low-mass Cepheids). RGs in this group show the lowest vmic values: ![Mathematical equation: $\[\bar{v}_{\text {mic}}\]$](/articles/aa/full_html/2025/09/aa54907-25/aa54907-25-eq12.png) = 1.50±0.27 km s−1. Interestingly, the transition from high to low vmic appears again around log Teff =3.65–3.70 dex, as seen in Group 2.
= 1.50±0.27 km s−1. Interestingly, the transition from high to low vmic appears again around log Teff =3.65–3.70 dex, as seen in Group 2.
Group 4 (vmic ≤4 km s−1, 1.0 <log(ℒ/ℒ⊙)≤1.6; Minit ~1–3 M⊙). This group is populated primarily by MS AFGK-type stars (including γ Doradus and δ Scuti variables), and a smaller number of post-MS FG-type stars and RGs (see Figs. 2 and A.1).
Although vmic is small (below 4 km s−1), it remains significant and displays a non-monotonic temperature dependence. A clear peak is seen at 3.85 ≲logTeff ≲3.95, with a gradual decline toward both higher and lower temperatures. Near logTeff = 4.0 and 3.7 dex, vmic approaches zero (see lower-right panel of Fig. 6). This pattern is consistent with previous findings for AF-type dwarfs (Sect. 4.1), and our results extend the observed decline into the cooler GK-dwarf and RG regimes.
To summarise, on a global scale photospheric microturbulence depends non-monotonically on ℒ/ℒ⊙ (a proxy for initial mass) and Teff (a proxy for evolutionary phase among stars of similar Minit). The analysis reveals at least two broad maxima in vmic: a stronger one among cooler O- and B-type SGs (Minit ≳15 M⊙, 4.15≲logTeff ≲4.45 dex), and a weaker one among AF-type dwarfs (Group 4, 3.8≲logTeff ≲4.0 dex). These results suggest that vmic is linked to one or more physical processes whose activity depends on mass and temperature, likely in a manner that reflects the trends observed in the empirical vmic map.
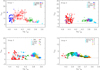 |
Fig. 6 vmic–Teff distribution of the sample stars divided into four spectral luminosity subgroups as defined in Sect. 5.2. Symbols and colours as indicated in the legend with LC V/IV and LC III/I targets highlighted by solid and open circles, respectively. In the top left panel the steep drop in vmic is highlighted by a gray vertical line. For high-mass stars (Minit ≥8 M⊙, Gr. 1&2) the uncertainty in the determination of vmic is typically between 1 and 5 km s−1; for low-mass ones (Minit ≤8 M⊙, Gr. 3 & 4) it is generally below 1 km s−1 (for more details, see the text). |
6 Discussion
In this section, we present several examples demonstrating how our observational database can serve as a complementary tool to evaluate theoretical scenarios proposed to explain specific phenomena observed in hot massive stars in the Milky Way. These include, for example, the hypothesised connection between micro-turbulence and stellar convection (Sect. 6.1); the observed deficit of slow rotators and stars with very low macro-turbulent broadening (Sects. 6.2 and 6.3, respectively); and the longstanding discrepancy between spectroscopic and evolutionary mass estimates for O-type stars (Sect. 6.4).
6.1 Micro-turbulence and stellar convection
A physical connection between photospheric micro-turbulence and stellar convection in low-mass stars was first proposed by Edmunds (1978), and later confirmed theoretically for the Sun by Asplund et al. (2000a,b). For hot, massive stars, Cantiello et al. (2009) similarly noted a correlation between observed micro-turbulent velocities in OB stars at varying metallicity and the predicted average convective velocities in the iron convection zone (FeCZ).
More recently, Grassitelli et al. (2015a,b) reported a close connection between the empirical macro-turbulent velocity (vmac) of a large sample of Galactic stars and the maximum turbulent pressure fraction (MTPF) in non-rotating solar-metallicity models. This result was confirmed by Cantiello et al. (2021), who further showed that the properties of subsurface convection correlate with both the timescale and the amplitude of stochastic low-frequency photometric variability.
Encouraged by the hypothesis that subsurface convection may drive small-scale velocity fields in the stellar photosphere, we compared the vmic map shown in Fig. 2 with the predicted distribution of the MTPF from Grassitelli et al. (2015a,b) (see their Fig. 4). A clear resemblance emerges upon inspection, and the agreement becomes even more evident with the results in Fig. 7, where the vmic velocities of the sample stars are directly overplotted on the corresponding MTPF values derived from models that incorporate both stellar rotation and turbulent pressure13. This qualitative result was further confirmed by statistical tests which indicate that the empirical vmic and the predicted MTPF are strongly correlated: ρ ≳ 0.8 for both the high and low mass targets.
While still preliminary, these findings suggest a strong physical link between photospheric micro-turbulence and envelope convection, with the amplitude of turbulent pressure fluctuations (TPF) providing a useful indicator. The broad vmic maximum seen in higher-mass OB stars appears to be tied to the peak TPF in the FeCZ (logℒ/ℒ⊙≳3.4–3.5). In contrast, AF(G)-type dwarfs, giants, and supergiants (including classical Cepheids) exhibit a similarly pronounced peak that may stem from significant TPF (≳10%) in the hydrogen convection zone. This convection zone is predicted to emerge from the ZAMS at logℒ/ℒ⊙≈1.0 and extend up to the more luminous supergiants with 3.60≲logTeff ≲3.85 (see Fig. 2 of Cantiello and Braithwaite 2019 and preliminary results in Fig. 7).
For main sequence B stars (including β Cephei variables and SPBs), it is noteworthy that many exhibit non-negligible vmic despite occupying a region where the turbulent pressure contribution is predicted to be relatively small (below a few percent; see the upper panel of Fig. 7). One possible explanation is that a distinct, non-rotational line-broadening mechanism unrelated to subsurface convection may be contributing to an enhanced vmic. Since most outliers lie in the part of the diagram where highorder g-mode and low-order p-mode pulsations are expected (Sect. 4.2; Figs. 4 and A.1), we propose that these oscillations could account for the unusually large vmic values observed in some MS B stars. In support of this idea, Simón-Díaz et al. (2017) found significant differences in line-profile shapes and variability between MS B stars and OB supergiants, which they interpreted as empirical evidence for multiple types of non-rotational line-broadening mechanisms operating in hot massive stars.
In summary, velocity fields generated by envelope convection zones (Cantiello et al. 2009, 2021; Jiang et al. 2015; Grassitelli et al. 2015a,b; Schultz et al. 2023) provide a plausible explanation for both micro- and macro-turbulence. However, the specific mechanisms linking envelope convection to the observed surface velocity fluctuations remain uncertain. One possible scenario is that convective plumes retain their momentum as they enter thermally diffusive, convectively stable layers (Jiang et al. 2015), resulting in surface velocities proportional to those within the convective zone. Alternatively, pressure perturbations may trigger high-order pulsations that propagate outward, thereby inducing velocity perturbations at the stellar surface (Cantiello et al. 2009; Grassitelli et al. 2015b). To clarify exactly how (sub-)surface convection zones affect surface velocity fields, further radiation- (magneto)hydrodynamic simulations of the outer envelopes of early-type stars are clearly warranted (Jiang et al. 2015; Schultz et al. 2020; Schultz et al. 2022, 2023).
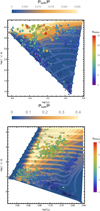 |
Fig. 7 Spectroscopic HRD with coloured region representing the maximum ratio of turbulent pressure to total pressure in stellar envelopes as derived from 1D stellar evolution models. Over-plotted we have the photospheric micro-turbulent velocities of the sample stars colour-coded as indicated in the legends (preliminary results). |
Micro-turbulence and the deficit of slow rotators for Galactic stars of various parameters separated by spectral type (OBAFGK), luminosity class (dw – dwarfs; g – giants; sg – supergiants) and initial stellar mass: Group 1 – Minit ≳15 M⊙; Group 2 – 8 M⊙ ≲Minit ≲15 M⊙; Group 3 – 3 M⊙ ≲Minit ≲8 M⊙; Group 4 – 3 M⊙ ≲Minit ≲1 M⊙.
6.2 Micro-turbulence and the deficit of slow rotators among massive OB stars
The near absence of slow rotators among massive O-type stars and early-B supergiants (SGs) has been recognised for decades, with Conti and Ebbets (1977) among the first to highlight the issue. Although this phenomenon has often been attributed to the presence of non-rotational line broadening-commonly referred to as macro-turbulence – recent studies have shown that the problem persists even when the effects of vmac are taken into account (Sunqvist et al. 2013; Markova et al. 2014; Simón-Díaz & Herrero 2014; Simón-Díaz et al. 2017). Current methodologies for determining projected rotational velocities (v sin i)—such as the Fourier Transform (FT), goodness-of-fit (GOF), and combined FT+GOF techniques, systematically neglect the role of micro-turbulence. Yet, theoretical models suggest that vmic introduces an upper limit to v sin i, below which stars cannot be observed. This limit, referred to hereafter as v sin i (upl), was introduced by Simón-Díaz & Herrero (2014) and merits observational testing.
To constrain the proposed connection between vmic and v sin i (upl), we undertook the following approach. First, we compiled a large set of v sin i values from the literature for Galactic stars with various parameters, prioritising those already included in our database (see below). Second, we analysed the behaviour of v sin i (upl) as a function of Teff, categorising stars into the same four spectral luminosity subgroups previously used to examine vmic. Third, we compared the trends of v sin i (upl) and vmic within each subgroup to identify potential correlations.
The key results of this analysis are presented in Figs. 8 and 9 and summarised in Table 3. For all stars except those of OB spectral type, v sin i values (from Firnstein & Przybilla 2012; Lyubimkov et al. 2015; Ivanyuk et al. 2017; Gebran et al. 2010; Luck 2018a; Kahraman et al. 2016; Takeda et al. 2008) were derived in tandem with vmic, enabling direct comparison. For OB stars, on the other hand, we used v sin i values published by Simón-Díaz et al. (2017) (depicted as solid (DWs) and open (SGs) circles in both figures), resulting in an indirect comparison. It is important to note that for a non-negligible number of stars later than B-type (excluding luminous A-type SGs), the incorporated v sin i values do not account for macro-turbulent broadening. As a result, these values may be somewhat overestimated; such stars are marked as small dots surrounded by a ring in both figures (see Lyubimkov et al. 2015; Niemczura et al. 2015 for further details).
While Fig. 8 reinforces earlier findings that the most massive O-type stars and B-type supergiants (Group 1) lack slow rotators, it also reveals that this phenomenon extends into the lower-mass B-star regime (Group 2). Across the entire high-mass domain (ℒ/ℒ⊙≳3.3), v sin i (upl) decreases monotonically with decreasing spectroscopic luminosity, and thus with decreasing Minit (see Markova et al. 2014).
Figure 9 further shows that in addition to Minit, v sin i (upl) – or more precisely ![Mathematical equation: $\[\overline{\text { vsini (upl)}}\]$](/articles/aa/full_html/2025/09/aa54907-25/aa54907-25-eq18.png) , defined here as a visual average of nearby stars with similar v sin i (upl) (horizontal solid lines in each panel) – also depends on Teff, with differing trends across the various mass subgroups. For Group 1 stars with logTeff ≳4.5 (typically of O spectral type),
, defined here as a visual average of nearby stars with similar v sin i (upl) (horizontal solid lines in each panel) – also depends on Teff, with differing trends across the various mass subgroups. For Group 1 stars with logTeff ≳4.5 (typically of O spectral type), ![Mathematical equation: $\[\overline{\text { vsini (upl)}}\]$](/articles/aa/full_html/2025/09/aa54907-25/aa54907-25-eq19.png) declines steeply toward cooler temperatures, with supergiants (open circles) consistently showing higher values than dwarfs (solid circles) of similar Teff (see the two solid sloped lines in the top panel; see also Simón-Díaz & Herrero 2014). In the remaining stars, a broad maximum in
declines steeply toward cooler temperatures, with supergiants (open circles) consistently showing higher values than dwarfs (solid circles) of similar Teff (see the two solid sloped lines in the top panel; see also Simón-Díaz & Herrero 2014). In the remaining stars, a broad maximum in ![Mathematical equation: $\[\overline{\text { vsini (upl)}}\]$](/articles/aa/full_html/2025/09/aa54907-25/aa54907-25-eq20.png) appears within the range 4.5≲logTeff ≲4.00 (corresponding to early- to late-type B supergiants), followed by a gradual decrease at cooler temperatures. For AF-type supergiants (logTeff ≲4.0 dex),
appears within the range 4.5≲logTeff ≲4.00 (corresponding to early- to late-type B supergiants), followed by a gradual decrease at cooler temperatures. For AF-type supergiants (logTeff ≲4.0 dex), ![Mathematical equation: $\[\overline{\text { vsini (upl)}}\]$](/articles/aa/full_html/2025/09/aa54907-25/aa54907-25-eq21.png) values tend to fall below 5 km s−1, approaching zero on average.
values tend to fall below 5 km s−1, approaching zero on average.
For Group 2 and Group 3 stars, a notable deficit of slow rotators is observed among more evolved B-type stars (open circles, 4.2≤logTeff ≤4.0), whereas the remainder of the sample appears to be largely unaffected by this phenomenon.
Interestingly, even among low-mass AF(G)-type dwarfs (Gr. 4), our results reveal an absence of stars with low v sin i. While this finding could potentially be attributed to overestimated v sin i values due to neglected macro-turbulent broadening, we find this explanation unlikely. More massive and evolved AF-type giants and supergiants (Groups 1 to 3), which are more strongly affected by micro-turbulence (up to a factor of two; see Fig. 3 and Gray 1984; Gray & Toner 1987; Firnstein & Przybilla 2012; Ryabchikova et al. 2015), do not show any signs of a slow-rotator deficit.
Regarding the proposed relationship between v sin i (upl) and vmic – more specifically, between ![Mathematical equation: $\[\overline{\text { vsini (upl)}}\]$](/articles/aa/full_html/2025/09/aa54907-25/aa54907-25-eq22.png) and
and ![Mathematical equation: $\[\bar{v}_{\text {mic}}\]$](/articles/aa/full_html/2025/09/aa54907-25/aa54907-25-eq23.png) (in each panel the solid and dashed horizontal lines, respectively) – our results (Table 3) indicate that in stars strongly influenced by micro-turbulence (
(in each panel the solid and dashed horizontal lines, respectively) – our results (Table 3) indicate that in stars strongly influenced by micro-turbulence (![Mathematical equation: $\[\bar{v}_{\text {mic}}\]$](/articles/aa/full_html/2025/09/aa54907-25/aa54907-25-eq24.png) ≳5 km s−1, Gr. 1 excluding O-type stars), the two quantities vary in tandem:
≳5 km s−1, Gr. 1 excluding O-type stars), the two quantities vary in tandem: ![Mathematical equation: $\[\overline{\text { vsini (upl)}}\]$](/articles/aa/full_html/2025/09/aa54907-25/aa54907-25-eq25.png) tends to be approximately 1.5 to 2.0 times larger than
tends to be approximately 1.5 to 2.0 times larger than ![Mathematical equation: $\[\bar{v}_{\text {mic}}\]$](/articles/aa/full_html/2025/09/aa54907-25/aa54907-25-eq26.png) , and even subtle features, such as local depressions, appear in both distributions (see vertical arrow). In stars that are less affected by micro-turbulence (Groups 2, 3, and 4), the relationship is non-uniform. Most targets have projected rotational velocities near zero (
, and even subtle features, such as local depressions, appear in both distributions (see vertical arrow). In stars that are less affected by micro-turbulence (Groups 2, 3, and 4), the relationship is non-uniform. Most targets have projected rotational velocities near zero (![Mathematical equation: $\[\overline{\text { vsini (upl)}}\]$](/articles/aa/full_html/2025/09/aa54907-25/aa54907-25-eq27.png) ≲5 km s−1), with more evolved MS B stars and AF-type dwarfs being exceptions, showing a marked deficit of slow rotators.
≲5 km s−1), with more evolved MS B stars and AF-type dwarfs being exceptions, showing a marked deficit of slow rotators.
As for the sample of O-type stars, while limitations in our dataset may influence the outcome (see Sects. 3.1 and 4), the top panel of Fig. 9 suggests that their ![Mathematical equation: $\[\overline{\text { vsini (upl)}}\]$](/articles/aa/full_html/2025/09/aa54907-25/aa54907-25-eq28.png) behaviour contrasts with that of their vmic. Specifically,
behaviour contrasts with that of their vmic. Specifically, ![Mathematical equation: $\[\overline{\text { vsini (upl)}}\]$](/articles/aa/full_html/2025/09/aa54907-25/aa54907-25-eq29.png) decreases with decreasing Teff, while vmic tends to increase.
decreases with decreasing Teff, while vmic tends to increase.
Since the v sin i and vmic values used in this analysis were independently derived, these results can be interpreted as suggestive evidence that in cooler O- and B-type supergiants, the observed lack of slow rotators may arise from the neglect of micro-turbulent broadening in FT/FT+GOF methods, as predicted by FASTWIND line-profile simulations (Simón-Díaz & Herrero 2014). However, for O-type stars near the zero-age main sequence (ZAMS), more evolved MS B-stars, and possibly AF-type dwarfs additional mechanisms likely contribute to the elevated ![Mathematical equation: $\[\overline{\text { vsini (upl)}}\]$](/articles/aa/full_html/2025/09/aa54907-25/aa54907-25-eq30.png) relative to
relative to ![Mathematical equation: $\[\bar{v}_{\text {mic}}\]$](/articles/aa/full_html/2025/09/aa54907-25/aa54907-25-eq31.png) .
.
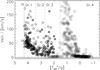 |
Fig. 8 Projected rotational rates of Galactic stars of various properties as a function of logℒ/ℒ⊙ (=[Teff 4/g]) with vertical lines dividing the objects into four spectral luminosity subgroups as defined in Sect. 5.2. Different symbols are used to highlight the v sin i determinations which do (solid (DWs) and open (SGs) circles) and do not (small dots surrounded by a ring) account for the effect of macro-turbulent broadening (for more information see Sect. 6.2). |
 |
Fig. 9 Micro-turbulent velocity of the sample stars separated by spectral luminosity (Gr.1–4), and by SpT and LC (same symbols and colours as in Fig. 3 with SPBs highlighted by a blue five-pointed star). Overplotted in gray are the adopted v sin i (same symbols as in Fig. 8). In each panel the horizontal solid and dashed lines indicate, respectively, the mean value of the upper detectability limit to v sin i averaged “by eye”, and the corresponding |
![Mathematical equation: $\[\bar{v}_{\text {mic}}\]$](/articles/aa/full_html/2025/09/aa54907-25/aa54907-25-eq17.png)
6.3 Micro-turbulence and the upper detectability limit to macro-turbulent broadening established in the OB star regime
The absence of OB stars with very low macro-turbulent velocity was first reported by Lefever et al. (2010) and Markova et al. (2014), and subsequently confirmed by Simón-Díaz et al. (2017). In all these studies, the effect of micro-turbulent broadening was neglected in the derivation of vmac. However, line-profile simulations with the FW code suggest that this omission can result in an upper detectability threshold for vmac, below which stars would not be observed. This threshold is referred to hereafter as vmac (upl) (Simón-Díaz & Herrero 2014). Consequently, the absence of low-vmac OB stars may plausibly be attributed to neglected micro-turbulent broadening, a hypothesis that warrants careful investigation.
To investigate this issue further, and following the strategy outlined in the previous section, we searched the literature for accurate and reliable vmac determinations for our sample stars, prioritising those obtained in parallel with vmic, Teff, and log g. As a result, we found suitable data for all stars except those of OB type: for massive AFG-type supergiants (Groups 1 and 2), we used values from Firnstein & Przybilla (2012) and Gray & Toner (1987); for low-mass FGK-type dwarfs (Group 4), we adopted values from Saar & Osten (1997), Doyle et al. (2013), and Gray (1984). For OB stars, we used the vmac values published by Simón-Díaz et al. (2017), excluding any stars for which vmac was reported as an upper limit.
To avoid potential systematic discrepancies caused by the use of different model line profiles (Markova et al. 2014; Simón-Díaz & Herrero 2014; Takeda & Ueno 2017), we considered only vmac values derived using the radial-tangential model. Additionally, for AF-type stars (excluding the most luminous supergiants), individual vmac measurements were not available. Instead, we relied on mean values across defined temperature and gravity ranges (denoted as ![Mathematical equation: $\[\overline{v_{\text {mac}}(u p l)}\]$](/articles/aa/full_html/2025/09/aa54907-25/aa54907-25-eq32.png) )) from Gray & Toner (1987), which we used as an alternative basis for our analysis.
)) from Gray & Toner (1987), which we used as an alternative basis for our analysis.
The main results of our vmac–vmic comparison, categorised by initial stellar mass (Groups 1 through 4) and by spectral type (SpT) and luminosity class (LC), are illustrated in Fig. 10 and summarised in Table 4. Key findings include:
• In addition to OB stars (Groups 1,2, and 3; logTeff ≳4.0), we observe a deficit of stars with very low macro-turbulent velocity (![Mathematical equation: $\[\overline{v_{\text {mac}}(u p l)}\]$](/articles/aa/full_html/2025/09/aa54907-25/aa54907-25-eq33.png) <5 km s−1) among massive AF-type giants and supergiants (Groups 1 and 2; 3.8≲logTeff ≲ 4.0), as well as possibly among dwarfs of similar temperatures (see the horizontal solid lines in each plot).
<5 km s−1) among massive AF-type giants and supergiants (Groups 1 and 2; 3.8≲logTeff ≲ 4.0), as well as possibly among dwarfs of similar temperatures (see the horizontal solid lines in each plot).
• For all stars except the hottest O-types and AF-type dwarfs (discussed below), higher values of ![Mathematical equation: $\[\overline{v_{\text {mac}}(u p l)}\]$](/articles/aa/full_html/2025/09/aa54907-25/aa54907-25-eq34.png) are generally correlated with higher
are generally correlated with higher ![Mathematical equation: $\[\bar{v}_{\text {mic}}\]$](/articles/aa/full_html/2025/09/aa54907-25/aa54907-25-eq35.png) . This correlation holds even for stars with relatively modest micro-turbulence (
. This correlation holds even for stars with relatively modest micro-turbulence (![Mathematical equation: $\[\bar{v}_{\text {mic}}\]$](/articles/aa/full_html/2025/09/aa54907-25/aa54907-25-eq36.png) ≲5 km s−1), as evidenced by a strong Spearman correlation (ρ =0.82, π=0.00; see Table 4).
≲5 km s−1), as evidenced by a strong Spearman correlation (ρ =0.82, π=0.00; see Table 4).
• For the hottest O-type stars (log Teff ≳4.5; SpT<O9), vmac (upl) tends to decrease with decreasing Teff, with supergiants systematically showing higher values than dwarfs at the same temperature. This trend is depicted by two solid sloped lines in the top panel (see also Fig. 9 in Simón-Díaz & Herrero 2014). Notably, this behaviour contrasts with that of vmic, which increases instead. While our sample of very massive O-stars near the ZAMS may be limited (see Sects. 3.1 and 4), the main implication is that, in these stars, macro- and micro-turbulence may arise from different physical mechanisms. This is an idea that has been already suggested by Aerts & Rogers (2015).
• For AF-type dwarfs, the incomplete data coverage stands in the way of firm observational constraints to be placed on vmac properties. Nevertheless, based on the available measurements and the vmac–Teff calibration from Gray (1984), represented by the solid curved line in the bottom panel of Fig. 10, an increasing trend in vmac toward higher temperatures is evident. A typical ![Mathematical equation: $\[\overline{v_{\text {mac}}(u p l)}\]$](/articles/aa/full_html/2025/09/aa54907-25/aa54907-25-eq38.png) of approximately 10 km s−1 at log Teff ≳3.8 dex (shown by the horizontal dotted line in the same plot) is consistent with the general behavior of vmic.
of approximately 10 km s−1 at log Teff ≳3.8 dex (shown by the horizontal dotted line in the same plot) is consistent with the general behavior of vmic.
Since the vmic and vmac values used in this analysis have been independently derived, the results outlined above suggest the following: First, a connection between small-scale and largescale turbulent motions in stellar photospheres–whether direct (see e.g. Mucciarelli et al. 2011 and Husser et al. 2013) or indirect (through a common physical origin; see Sect. 6.1) – appears likely and merits further empirical investigation. Second, although neglecting micro-turbulent broadening in the FT/FT+GOF method can contribute to the observed absence of stars with low vmac, this factor alone is unlikely to fully account for the phenomenon, which is observed across stars of varying properties throughout the HRD.
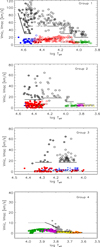 |
Fig. 10 Micro-turbulent velocity of the sample stars, separated by spectral luminosity (Gr. 1 to 4), and by SpT and LC as a function of Teff (same symbols and colours as in Fig. 3). Overplotted in gray are the adopted vmac data with solid and open circles representing LC V/IV and LC III/I objects, respectively. The mean value of the upper detectability limit to vmac averaged ’by eye’ and the corresponding |
![Mathematical equation: $\[\bar{v}_{\text {mic}}\]$](/articles/aa/full_html/2025/09/aa54907-25/aa54907-25-eq37.png)
Micro-turbulence and the upper detectability limit to macro-turbulent broadening for Galactic stars of various parameters separated by spectral type (OBAFG), luminosity class (dw – dwarfs; g – giants; sg –supergiants) and initial stellar mass: Group 1 – Minit ≳15 M⊙; Group 2 − 8 M⊙ ≲Minit ≲15 M⊙; Group 3 − 3 M⊙ ≲Minit ≲8 M⊙ and Group 4 − 3 M⊙ ≲Minit ≲1 M⊙.
6.4 Micro-turbulence and the mass problem in O stars
The so-called mass problem, namely the fact that evolutionary masses (Mevol) are higher than spectroscopic masses (Mspec), is a well-documented phenomenon in single O-type stars as well as in members of spectroscopic and detached eclipsing binaries (Herrero et al. 1992; Heap et al. 2006; Mahy et al. 2015; Markova et al. 2018; Castro et al. 2018; Bestenlehen et al. 2020; Mahy et al. 2022; Pavlovski et al 2023). Despite considerable attention, the issue remains under debate (see Serenelli et al. 2021), mainly due to the diversity of atmosphere models and evolutionary tracks employed to derive Mspec and Mevol, as well as the dependence on the choice of diagram (HRD, sHRD, or Kiel) used for comparison (Markova & Puls 2015; Garland et a. 2017; Sabín-Sanjulián et al. 2017; Markova et al. 2018; Castro et al. 2021).
While many studies point toward shortcomings in evolutionary models as the primary culprit, such as missing or inadequately treated physics (Martins & Palacios 2013; Keszthelyi et al. 2017; Pavlovski et al 2018; Berlanas et al. 2018; Tkachenko et al. 2020; Johnston 2021; Johnston et al. 2023), systematic uncertainties in spectroscopic parameters may also play a role (Sander et al. 2015). Notably, both the FW and CMFGEN codes neglect the contribution of micro-turbulent pressure in their hydrostatic or hydrodynamic balance equations. This omission likely leads to underestimated surface gravities and, therefore, underestimated Mspec values (Smith & Howarth 1998; Markova & Puls 2015; Mahy et al. 2015; Markova et al. 2018; Castro et al. 2018; González-Torà et al. 2025). This is an effect warranting a more detailed investigation.
To explore the impact of neglected micro-turbulent pressure on derived gravities, we used our database to estimate the correction to log g using a simple relation14 and estimated that for supergiants with logTeff of 4.60 dex and 4.50 dex, an underestimation in this quantity by about 0.08–0.14 dex – corresponding roughly to Mspec being about 0.28–0.37 dex lower than the actual value – can be expected. Analogous results for O-type dwarfs with similar temperatures indicate log g and Mspec values lower by about 0.02–0.01 dex and 0.14–0.10 dex, respectively15.
Stars with Minit below 30—32 M⊙. For less massive O-stars (generally dwarfs and giants), there is ample empirical evidence suggesting that the mass problem is model-independent but may depend on the main photospheric characteristics of the stars. See, e.g., Markova & Puls (2015) and Markova et al. (2018) for objects in the MW: ΔlogMspec of ~0.09 to ~0.12 dex; Ramírez-Agudelo et al. (2017) and Sabín-Sanjulián et al. (2017) for objects in the LMC: ΔlogMspec of ~0.08 and ~0.10 dex, respectively; Mahy et al. (2022) for stars in the SMC: ΔlogMspec =0.10 dex (an estimate derived from their Fig. 4); Putkuri et al. (2018) (see also Pavlovski et al 2023 and references therein): 0.16 dex≲ΔlogMspec ≲0.09 dex16.
Compared to these empirical findings, our estimates of ΔlogMspec (vmic) are surprisingly close (and in the right direction). This suggests that the mass discrepancy observed in less massive O-stars may, to a large extent, be mitigated if the FW and CMFGEN modelling properly accounts for the effect of micro-turbulent pressure.
Stars with Minit ≳40 M⊙. For more massive O-stars, the mass problem is strongly model-dependent and also sensitive to the main photospheric parameters, making it difficult to confirm or rule out definitively (see e.g. Markova et al. 2018; Castro et al. 2021; Bouret et al. 2021; Berlanas et al. 2018; Bestenlehen et al. 2020 and references therein). For these reasons, no firm observational constraints can yet be placed on the effect of neglected micro-turbulent pressure on Mspec. Nevertheless, using our database and results from Markova et al. as a reference17 we suggest that if this effect is accounted for, it could either reduce the size of the discrepancy by ~40% and ~70% at logTeff of 4.60 dex and 4.50 dex, respectively (Ekström et al. 2012 models with rotation) or increase it by ~0.28 dex to ~0.20 dex, the latter value corresponding to supergiants with logTeff ≈4.48 (Brott et al. models with Vrot =300 km s−1).
While they are not perfect, these estimates may serve to place rough empirical constraints on any attempt to explain the lack of consistency between Mspec and Mevol in more massive O-stars when their properties are derived using the FW and CMFGEN codes.
7 Summary and conclusions
We have compiled an empirical database of Teff, log g, v sin i, vmac, and vmic determinations for more than 1800 presumably single stars with diverse properties in the MW. Both non-pulsating and pulsating objects are included, with the latter comprising ~32% of the total sample and encompassing six types of pulsators: β Cephei, SPBs, γ Doradus, δ Scuti, classical Cepheids, and red giants and supergiants.
Based on these data, we studied the behaviour of photospheric micro-turbulence as a function of Teff and log g within each SpT, LC, and pulsation type. We provide the first comprehensive and statistically significant overview of this phenomenon in Galactic stars. As a first application, we place observational constraints and evaluate several scenarios proposed to explain specific phenomena in hot, massive stars whose nature and origin remain poorly understood. The main results of our analysis are summarised below:
• Photospheric micro-turbulence is a universal spectral feature observed across all stars, regardless of their SpT, LC, or pulsational properties. Since the characteristics of this feature do not depend on the analysis method used, we conclude that the vmic phenomenon is not an artifact of a specific modelling approach, but rather reflects a genuine physical process whose influence on photospheric line formation is not yet incorporated in current atmospheric models (Sections 4 and 4.2).
• The properties of photospheric micro-turbulence depend significantly on Teff and log g. However, the behaviour is too diverse to permit a deeper understanding when studied within a single SpT (Sect. 4 and Table 1).
• Preliminary results from a direct comparison between observed photospheric micro-turbulence in our sample and the amplitude of turbulent pressure fluctuations in models (accounting for stellar rotation with Vrot (init) = 300 km s−1 and turbulent pressure) strongly suggest that subsurface convection is the primary mechanism behind small-scale velocity fields in the photosphere. This idea, initially proposed by Edmunds (1978) and Cantiello et al. (2009), remains poorly understood in terms of its detailed mechanisms. Two plausible scenarios include: (i) high-order pulsations propagating outward and inducing surface velocity perturbations (Cantiello et al. 2009; Grassitelli et al. 2015b); and (ii) convective plumes retaining momentum as they penetrate thermally diffusive, convectively stable layers (Jiang et al. 2015; Schultz et al. 2020; Schultz et al. 2022). Further clarification will require dedicated radiation-(magneto)hydrodynamic simulations of early-type stellar envelopes.
• Using our database, we placed observational constraints on two specific phenomena observed in hot, massive stars whose origin is still unclear: the deficit of slow rotators and the absence of stars with very low vmac velocities. Our results indicate that: (i) these phenomena are not limited to more massive OB stars, as previously thought, but also involve objects with markedly different characteristics, including more evolved LCIII B-stars and AF-type dwarfs; and (ii) neglecting micro-turbulent broadening in the FT and combined FT+GOF methods used to derive v sin i and vmac – while potentially contributing, as suggested by Simón-Díaz & Herrero (2014) – cannot solely account for the observed lack of stars with very low v sin i and vmac in certain HR diagram regions (Sections 6.2 and 6.3).
• Rough estimates of the effect of micro-turbulent pressure on surface equatorial gravities derived from observations strongly suggest that the mass discrepancy observed in O-stars with Minit ≲30–32 M⊙ can be largely – if not entirely – resolved, provided that the micro-turbulent pressure term is properly included in 1D FW/CMFGEN modelling. This is consistent with the findings of González-Torà et al. (2025), based on multidimensional O-star model atmospheres.
Although previous studies have reported micro-turbulent velocities exceeding the sound speed in a few OB supergiants, our analysis provides the first strong empirical evidence that such small-scale supersonic motions are common among OB supergiants with logTeff ≳4.15 dex. As these velocity fields can drive key physical processes in massive stars18, this finding highlights the need for more realistic theoretical simulations and evolutionary models that explicitly incorporate the presence of small-scale supersonic motions in the outer envelopes of early-type stars.
Acknowledgements
NM thanks Dr. A. Herrero for useful comments and suggestions for improvements on the manuscript. The IANAO (BAS) acknowledges financial support from the Ministry of Education and Science of Republic of Bulgaria trough the National Roadmap project. The Center for Computational Astrophysics at the Flatiron Institute is supported by the Simons Foundation.
Appendix A Micro-turbulence and stellar pulsations
A total of 363 Galactic stars identified as radial pulsators (classical Cepheids) and non-radial pulsators (slowly pulsating B stars (SPBs), β Cephei, γ Doradus, and δ Scuti variables) have been included in our analysis. To this sample, we also added a large number of variable stars in the red giant and supergiant (RG/SG) phase to cover the later stages of red-ward evolution on the HRD.
While the relatively small number of non-radial pulsators (non-RPs) – 160 in total – might seem limiting for our investigation, the lower panel of Fig. 1 shows that: i) the balance between radial and non-radial pulsators is nearly even, at 55% versus 45%, respectively; and ii) their distribution by oscillation type is reasonable, although the subsample of β Cephei variables is somewhat under-represented. Furthermore, the positions of the non-RPs on the sHRD generally align well with theoretical predictions for their respective oscillation types, with most of the relevant parameter space being reasonably well covered (with the exception of β Cephei stars; see Fig. A.1). The same applies to the Cepheid instability strip and the red giant branch, both of which are also well represented. These observations support the conclusion that our dataset enables a meaningful and realistic analysis of the vmic properties of pulsating/variable stars and red giants.
The main results of the vmic analysis for the sample pulsators (grouped by oscillation type) and RGs are illustrated in Figures 4 and A.1, and summarised in Table 2. We note that for the nonRPs, we performed a comparison with non-pulsating stars of similar Teff and log g (hereafter, referred to as reference stars) to detect potential differences (if any) attributable to the respective oscillations.
A.1 Non-radial pulsators
A.1.1 Beta Cephei and slowly pulsating B stars
β Cephei and SPBs are B-type pulsators which oscillate, respectively, in coherent low-order pressure (p) (Stankov & Handler 2005) and high-order gravity (g) (Waelkens 1991) modes excited by the κ-mechanism arising from the iron opacity bump at Teff ≈ 200 kK. Both are MS stars with the former, on average, more massive and hotter than the last: B0-B3 vs. B3-B9, and 8 M⊙ ≲Minit ≲25 M⊙ versus 3 M⊙ ≲Minit ≲10 M⊙.
β Cephei. There are 14 β Cephei variables in our sample with five of them recently suspected to be members of this subgroup (Burssens et al. 2020). While the distribution of these stars is compatible with the instability strip for p modes oscillations calculated by Miglio et al. (2007) and by Moravveji (2016)19 (shown in Fig. A.1 (dark gray shaded area and the solid red line bordered rectangle, respectively), the majority (if not all) of them are located in the high-mass portion of the predicted area (Minit ≳9 M⊙), leaving the low-mass region underpopulated.
From the top panels of Fig. 4 it appears that the range of vmic for the sample of β Cephei variables is qualitatively similar to that of the reference stars, a result supported by our statistical test (see corresponding data in Table 2). We note that due to the limited number of β Cephei variables and their heterogeneous distribution across the corresponding log g and Teff intervals, these results should be interpreted with caution.
Slowly pulsating B stars. Sixteen bona fide SPBs and 37 candidates were initially included in our sample (all from Lefever et al. 2010). As shown in Fig. A.1, all but 13 of these stars (dark blue circles) lie within the instability strip for g-mode pulsations as computed by Miglio et al. (2007) and Moravveji (2016) (light gray shaded area and the dashed red-bordered rectangle, respectively). Given that the photometric behavior of these outliers is comparable to that of the confirmed SPBs (Lefever et al. 2010), and that their vmic properties are also similar (see corresponding data in Table 2), we retained these stars in the subsequent analysis to improve statistical robustness.
Interestingly, while the statistical properties of photospheric microturbulence in SPBs and their reference stars are quite similar, unlike the latter, none of the SPBs exhibit vmic ≲2 km s−1. Additionally, the temperature dependence of vmic may differ between the two groups (see Tables 2). If not attributable to observational selection effects or uncertainties in the derived stellar parameters, these findings may suggest that stellar pulsations caused by high-order g-mode oscillations influence the vmic properties of SPBs. However, due to the absence of reference stars with log g <3.5 dex, this possibility requires further investigation and independent verification.
A.1.2 Delta Scuti and Gamma Dor variables
Overall 44 δ Scuti and 52 γ Dor non-RPs are included in our analysis. On the sHRD, these stars are predominantly located within the theoretical δ Scuti-γ Dor instability region (light pink shaded area in Fig. A.1), although a non-negligible number appear somewhat cooler and less massive than expected. A detailed discussion of this issue can be found in Uytterhoeven et al. 2011; Guzik 2021.
From the third and fourth rows of Fig. 4, it appears that the sample δ Scuti and γ Dor stars exhibit significant micro-turbulent broadening, with quite similar characteristics in both magnitude and in the dependence on Teff and log g. No evidence was found for notable differences in the vmic properties of these non-radial pulsators compared to the corresponding reference stars (see data in Table 2).
A.2 Classical Cepheids and red giants and supergiants
Classical Cepheids. A total of 199 classical Cepheids are included in our sample. From Fig. A.1, it is evident that their positions on the sHRD fall entirely within the Cepheid instability strip (3 M⊙ ≲Minit ≲20 M⊙ and 3.70≲Teff ≲3.85). The majority of these stars (~83% of the sample) are in the low-mass regime with Minit <9 M⊙, that is not surprising, as low-mass stars evolve more slowly than their high-mass counterparts.
From the fifth row panels of Fig. 4, we find that classical Cepheids exhibit significant micro-turbulent broadening, with an effect that appears to increase toward lower gravities and cooler temperatures (and hence higher Minit). While this trend is qualitatively consistent with similar results for the non-variable stars of various SpT (see Sect. 4.1 and Fig. 3), it is not statistically confirmed: there was no significant correlation seen between vmic and log g (or Teff) across the total sample, nor within each of the two mass subgroups (see Table 2 and the two horizontal solid lines in the fifth row panel on the left of Fig. 4, which represent the ![Mathematical equation: $\[\bar{v}_{\text {mic}}\]$](/articles/aa/full_html/2025/09/aa54907-25/aa54907-25-eq43.png) of the high- and low-mass Cepheids).
of the high- and low-mass Cepheids).
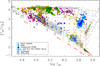 |
Fig. A.1 Same as Fig. 2, but with pulsating stars additionally highlighted as indicated in the legend. The theoretical instability strips for β Cephei and SPBs from Miglio et al. (2007) (dark and light grey shaded areas) and from Moravveji (2016) (red solid and dashed line bordered rectangles), and the instability domain for γ Doradus and δ Scuty variables (from Rodriguez & Breger 2001, light pink shaded area) are also provided for a direct comparison. |
Although it remains uncertain whether massive Cepheids are more strongly affected by micro-turbulence than their lower-mass counterparts, there are at least two possible factors that may influence the observed results: i) observational selection effects, which tend to favour low-mass targets (as noted above) and ii) significant scatter in vmic at fixed Teff and log g – generally exceeding the 3σ measurement error – likely caused by the combined use of ’snapshot’ and ’phase-averaged’ determinations of Teff, log g, and vmic (see Proxauf et al 2018; Luck 2018b and references therein for more details). More research with improved statistics, particularly for high-mass Cepheids, and predominantly phase-averaged Teff and log g values is needed to determine whether the properties of vmic differ significantly between high- and low-mass Cepheids.
Red giants and supergiants. A total of 222 stars identified as being in the red giant (RG) phase were initially included in our database. Based on their distribution on the sHRD (Fig. 2), all but seven lie below the 9 M⊙ evolutionary track and are thus classified as genuine RGs; the remainder are red supergiants (RSGs). Given the significant differences in the physics and evolutionary fate of red giants and supergiants (see e.g. Goldberg et al. 2020 and references therein), we made a clear distinction between these two subgroups to ensure robust analysis.
From the final row panels of Fig. 4, two main features are immediately apparent: First, the photospheric micro-turbulence of the RG and RSG samples (light and dark blue solid circles, respectively) is small but significant. Second, although vmic generally increases toward lower gravities and cooler temperatures, RSGs show systematically lower velocities – by about 0.5 km s−1 – than expected for their log g values20 (see Table 2 and the red solid line in the bottom-left panel of Fig. 4). These findings suggest that the vmic properties of RSGs may differ from those of RGs —- a possibility that is not unexpected (see above) —- but given the limited number of RSGs in the sample, this conclusion remains tentative.
Appendix B Tables
Model atmosphere and radiative transfer codes used as a source of Teff, log g and vmic data for the sample stars
Overview of the sample stars with photometric Teff and log g determinations and details regarding the corresponding analysis.
Overview of the sample stars with spectroscopically derived properties and details regarding the corresponding analysis.
References
- Aerts, C., & Rogers, T. M. 2015, ApJ, 806, 33 [Google Scholar]
- Aerts, C., Simón-Díaz, S., Groot, P. J., & Degroote, P. 2014, A&A, 569, A118 [NASA ADS] [CrossRef] [EDP Sciences] [Google Scholar]
- Andrievsky, S. M., Lepine, J. R. D., Korotin, S. A., et al. 2013, MNRAS, 428, 3252 [NASA ADS] [CrossRef] [Google Scholar]
- Asplund, M., Nordlund, A., Trampedach, R., et al., 2000a, A&A, 359, 729 [NASA ADS] [Google Scholar]
- Asplund, M., Nordlund, A., Trampedach, R., et al. 2000b, A&A, 359, 743 [Google Scholar]
- Bailey, J. E., Nagayama, T., Loisel, G. P., et al. 2015, Nature, 517, 56 [NASA ADS] [CrossRef] [Google Scholar]
- Bell, R. A. 1971, MNRAS, 154, 343 [Google Scholar]
- Berlanas, S. R., Herrero, A., Comerón, A., et al. 2018, A&A, 612, A50 [NASA ADS] [CrossRef] [EDP Sciences] [Google Scholar]
- Bestenlehner, J. M., Crowther, P. A., Caballero-Nieves, S. M., et al. 2020, MNRAS, 499, 1918 [Google Scholar]
- Bouret, J.-C., Lanz, T., & Hillier, D. J. 2005, A&A, 438, 301 [NASA ADS] [CrossRef] [EDP Sciences] [Google Scholar]
- Bouret, J.-C., Martins, F., Hillier, D. J., et al. 2021, A&A, 647, A134 [NASA ADS] [CrossRef] [EDP Sciences] [Google Scholar]
- Brott, I., de Mink, S. E., Cantiello, M., et al. 2011, A&A, 530, A115 [NASA ADS] [CrossRef] [EDP Sciences] [Google Scholar]
- Burssens, S. S., Simón-Díaz, S., Bowman, S. D., et al. 2020, A&A, 639, A81 [NASA ADS] [CrossRef] [EDP Sciences] [Google Scholar]
- Butler, K., & Giddings, J. R. 1985, Newsl. Anal. Astron. Spectra, No. 9 [Google Scholar]
- Cantiello, M., & Braithwaite. 2019, ApJ, 883, 106 [Google Scholar]
- Cantiello, M., Langer, N., Brott, I., et al. 2009, A&A, 499, 279 [NASA ADS] [CrossRef] [EDP Sciences] [Google Scholar]
- Cantiello, M., Lecoanet, D., Jermyn, A. S., et al. 2021, ApJ, 915, 112 [NASA ADS] [CrossRef] [Google Scholar]
- Carneiro, L. P., Puls, J., Hoffmann, T. L., et al. 2019, A&A, 623, A3 [NASA ADS] [CrossRef] [EDP Sciences] [Google Scholar]
- Castelli, F., & Kurucz, R. L. 2004, A&A, 419, 725 [NASA ADS] [CrossRef] [EDP Sciences] [Google Scholar]
- Castro, N., Fossati, L., Langer, N., et al. 2014, A&A, 570, A13 [NASA ADS] [CrossRef] [EDP Sciences] [Google Scholar]
- Castro, N., Oey, M. S., Fossati, L., & Langer, N. 2018, ApJ, 868, 57 [NASA ADS] [CrossRef] [Google Scholar]
- Castro, N., Crowther, P. A., Evans, C. J. et al. 2021, A&A, 645, A68 [NASA ADS] [CrossRef] [EDP Sciences] [Google Scholar]
- Conti, P. S., & Ebbets, D. 1977, ApJ, 213, 438 [CrossRef] [Google Scholar]
- Cordero, M. J., Pilachowski, C. A., Johnson, C. I., et al. 2014, ApJ, 780, 94 [Google Scholar]
- Crowther, P. A., Lennon, D. J., & Walborn, N. R. 2006, A&A, 446, 279 [NASA ADS] [CrossRef] [EDP Sciences] [Google Scholar]
- Daflon, S., Cunha, K., & Becker, S. 1999, ApJ, 522, 950 [Google Scholar]
- Daflon, S., Cunha, K., & Becker, S., et al. 2001, ApJ, 552, 309 [Google Scholar]
- Doyle, A. P., Davies, G. R., Smalley, B., et al. 2013, MNRAS, 428, 3164 [NASA ADS] [CrossRef] [Google Scholar]
- Dufton, P. L., Ryans, R. S. I., Trundle, C., et al. 2005, A&A, 434, 1125 [NASA ADS] [CrossRef] [EDP Sciences] [Google Scholar]
- Edmunds, M. G. 1978, A&A, 64, 103 [NASA ADS] [Google Scholar]
- Ekström, S., Georgy, C., Eggenberger, P., et al. 2012, A&A, 537, A146 [Google Scholar]
- Firnstein, M., & Przybilla, N. 2012, A&A, 543, A80 [NASA ADS] [CrossRef] [EDP Sciences] [Google Scholar]
- Fitzpatrick, E. L., & Massa, D. 2005, AJ, 129, 1642 [Google Scholar]
- Fraser, M., Dufton, P. L., Hunter, I., et al. 2010, MNRAS, 404, 1306 [Google Scholar]
- Garland, R., Dufton, P. L., Evans, C. J., et al. 2017, A&A, 603, A91 [NASA ADS] [CrossRef] [EDP Sciences] [Google Scholar]
- Gebran, M., & Monier, R. 2008a A&A, 483, 567 [NASA ADS] [CrossRef] [EDP Sciences] [Google Scholar]
- Gebran, M., & Monier, R. 2008b, A&A, 479, 189 [NASA ADS] [CrossRef] [EDP Sciences] [Google Scholar]
- Gebran, M., Vick, M., Monier, R., et al. 2010, A&A, 523, A71 [NASA ADS] [CrossRef] [EDP Sciences] [Google Scholar]
- Gebran, M., Monier, R., Royer, F., et al. 2014, in Conference Proceedings “Putting A Stars into Context: Evolution, Environment, and Related Stars”, Moscow, 2013 [Google Scholar]
- Giridhar, S., Ferro, A., & Parrao, L. 1997, PASP, 109, 1077 [Google Scholar]
- Godart, M., Simón-Díaz, S., Herrero, A., et al. 2017, A&A, 597, A123 [NASA ADS] [CrossRef] [EDP Sciences] [Google Scholar]
- Goldberg, J. A., Bildsten, L., & Paxton, B. 2020, ApJ, 891, 15 [Google Scholar]
- González-Torà, G., Sander, A. A. C., Sundqvist, J. O., et al. 2025, A&A, 694, A269 [NASA ADS] [CrossRef] [EDP Sciences] [Google Scholar]
- Grassitelli, L., Fossati, L., Simón-Díaz, S., et al. 2015, ApJ, 808, L31 [NASA ADS] [CrossRef] [Google Scholar]
- Grassitelli, L., Fossati, L., Langer, N., et al. 2015, A&A, 584, L2 [NASA ADS] [CrossRef] [EDP Sciences] [Google Scholar]
- Gray, R. O., 1984, ApJ, 281, 719 [NASA ADS] [CrossRef] [Google Scholar]
- Gray, R. O., & Toner, C. J. 1987, ApJ, 322, 360 [NASA ADS] [CrossRef] [Google Scholar]
- Gray, R. O., & Corbally, C. J. 1994, AJ, 107, 742 [Google Scholar]
- Gray, R. O., Graham, P. W., & Hoyt, S. R. 2001, AJ, 121, 2159 [NASA ADS] [CrossRef] [Google Scholar]
- Gustafsson, B., Edvardsson, B., Eriksson, K., et al. 2008, A&A 486, 951 [NASA ADS] [CrossRef] [EDP Sciences] [Google Scholar]
- Guzik, J. A. 2021, Front. Astron. Space Sci., 8, 55 [NASA ADS] [Google Scholar]
- Haucke, M., Cidale, L. S., Venero, R. O. J., et al. 2018, A&A, 614, A91 [NASA ADS] [CrossRef] [EDP Sciences] [Google Scholar]
- Heap, S. R., Lanz, T., & Hubeny, I. 2006, ApJ, 638, 409 [Google Scholar]
- Heiter, U., & Eriksson, K. 2006, A&A 452, 1039 [NASA ADS] [CrossRef] [EDP Sciences] [Google Scholar]
- Herrero, A., Kudritzki, R.-P., Vilchez, J. M., et al. 1992, A&A, 261, 209 [Google Scholar]
- Hillier, D. J., & Muller, D. L. 1998, ApJ, 496, 407 [NASA ADS] [CrossRef] [Google Scholar]
- Holgado, G., Simón-Díaz, S., Barbá, R. H., et al. 2018, A&A, 613, A65 [NASA ADS] [CrossRef] [EDP Sciences] [Google Scholar]
- Holgado, G., Simón-Díaz, S., Haemmerlé, L., et al. 2020, A&A, 638, A157 [NASA ADS] [CrossRef] [EDP Sciences] [Google Scholar]
- Humphreys, R., & Davidson, K. 1979, ApJ, 232, 409 [Google Scholar]
- Hunter, I., Dufton, P. L., Smartt, S. J., et al. 2007, A&A, 466, 277 [NASA ADS] [CrossRef] [EDP Sciences] [Google Scholar]
- Hunter, I., Brott, I., Langer, N., et al. 2009, A&A 496, 841 [NASA ADS] [CrossRef] [EDP Sciences] [Google Scholar]
- Hubeny, I. 1998, ASPC, 138, 139 [Google Scholar]
- Husser, T.-O., Wende von Berg, S., Dreizler, S., et al. 2013, A&A, 553, A6 [NASA ADS] [CrossRef] [EDP Sciences] [Google Scholar]
- Jiang, Y.-F., Cantiello, M., Bilstend, L., et al. 2015, ApJ 813, 74 [NASA ADS] [CrossRef] [Google Scholar]
- Jofre, P., Heiter, U., & Soubiran, C. 2019, ARA&A, 57, 571 [CrossRef] [Google Scholar]
- Johnston, C. 2021, A&A, 655, A29 [NASA ADS] [CrossRef] [EDP Sciences] [Google Scholar]
- Johnston, C., Michielsen, M., Anders, E. H., et al. 2023, ApJ, submitted [arXiv:2312.08315v1] [Google Scholar]
- Ivanyuk, O. M., Jenkins, J. S., Pavlenkol, Ya. V., et al. 2017, MNRAS, 468, 4151 [Google Scholar]
- Kahraman, A. F., Niemczura, E., De Cat, P., et al. 2016, MNRAS, 458, 2307 [CrossRef] [Google Scholar]
- Keszthelyi, Z., Puls, J., & Wade, Gr. 2017, A&A, 598, A4 [NASA ADS] [CrossRef] [EDP Sciences] [Google Scholar]
- Kilian, J. 1994, A&A, 282, 286 [Google Scholar]
- Kilian, J., Becker, S. R., Gehren, T., & Nissen, P. E. 1991, A&A, 244, 419 [NASA ADS] [Google Scholar]
- Kilian, J., Montenbruck, O., Nissen, P. E. 1994, A&A, 284, 437 [Google Scholar]
- Kudritzki, R.-P., 1992, A&A, 266, 395 [NASA ADS] [Google Scholar]
- Kurucz, R. L. 1993, ATLAS9 Stellar Atmosphere Programs and Grid, CD-ROM No. 13 (Cambridge, MA: Smithsonian Astrophysical Observatory) [Google Scholar]
- Kurucz, R. L., & Avrett, E. H. 1981, SAOSR, 391 [Google Scholar]
- Langer, N., & Kudritzki, R.-P. 2014, A&A, 564, A52 [NASA ADS] [CrossRef] [EDP Sciences] [Google Scholar]
- Lanz, T., & Hubeny, I. 2007, ApJS, 169, 83 [CrossRef] [Google Scholar]
- Lehmann, H., Tkachenko, A., Semaan, T., et al. 2011, A&A 526, A124 [CrossRef] [EDP Sciences] [Google Scholar]
- Lefever, C., Puls, J., & Aerts, C. 2007, A&A, 463, 1093 [NASA ADS] [CrossRef] [EDP Sciences] [Google Scholar]
- Lefever, C., Puls, J., & Morel, T. 2010, A&A, 515, A74 [NASA ADS] [CrossRef] [EDP Sciences] [Google Scholar]
- Lyubimkov, L., Rostopchin, S. I., & Lambert, D. L. 2004, MNRAS, 351, 745 [NASA ADS] [CrossRef] [Google Scholar]
- Lyubimkov, L., Lambert, D. L., Rostopchin, S. I., et al. 2010, MNRAS, 402, 1369 [Google Scholar]
- Lyubimkov, L. S., Lambert, D. L., Korotin, S. A., et al. 2015, MNRAS, 446, 3447 [NASA ADS] [CrossRef] [Google Scholar]
- Luck, R. E. 2018a, AJ, 155, 111 [Google Scholar]
- Luck, R. E. 2018b, AJ, 156, 171 [Google Scholar]
- Mahy, L., Rauw, G., De Becker, M., et al. 2015, A&A, 577, A23 [NASA ADS] [CrossRef] [EDP Sciences] [Google Scholar]
- Mahy, L., Sana, H., Shenar, T., et al. 2022, A&A, 664, A159 [NASA ADS] [CrossRef] [EDP Sciences] [Google Scholar]
- Markova, N., & Puls, J. 2008, A&A, 478, 823 [NASA ADS] [CrossRef] [EDP Sciences] [Google Scholar]
- Markova, N., & Puls, J. 2015, IAUS, 307, 117 [Google Scholar]
- Markova, N., Prinja, R. K., & Markov, H., et al. 2008, A&A, 487, 211 [NASA ADS] [CrossRef] [EDP Sciences] [Google Scholar]
- Markova, N., Puls, J., Simón-Díaz, S., et al. 2014, A&A, 562, A37 [NASA ADS] [CrossRef] [EDP Sciences] [Google Scholar]
- Markova, N., Puls, J., & Langer, N. 2018, A&A, 613, A12 [NASA ADS] [CrossRef] [EDP Sciences] [Google Scholar]
- Markova, N., Puls, J., Dufton, P., et al. 2020, A&A, 634, A12 [Google Scholar]
- Martins, F., & Palacios, A. 2013, A&A, 560, A16 [NASA ADS] [CrossRef] [EDP Sciences] [Google Scholar]
- Martins, F., Schaerer, D., & Hillier, D. J. 2005a, A&A, 436, 1049 [NASA ADS] [CrossRef] [EDP Sciences] [Google Scholar]
- Martins, F., Schaerer, D., Hillier, D. J., et al. 2005b, A&A, 441, 735 [NASA ADS] [CrossRef] [EDP Sciences] [Google Scholar]
- Massey, Ph., Neugent, K. F., Hillier, D. J., & Puls, J. 2013, ApJ, 768, 6 [NASA ADS] [CrossRef] [Google Scholar]
- Massey, Ph., Neugent, K., & Smart, B. 2016, ApJ, 152, 62 [Google Scholar]
- McEvoy, C. M., Dufton, P. L., Evans, C. J., et al. 2015, A&A, 575, A70 [NASA ADS] [CrossRef] [EDP Sciences] [Google Scholar]
- McErlean, N. D., Lennon, D. J., & Dufton, P. L. 1999, A&A, 349, 553 [NASA ADS] [Google Scholar]
- Miglio, A., Montalbán, & Dupret, M.-A. 2007, MNRAS, 375, L21 [Google Scholar]
- Moravveji, E. 2016, MNRAS, 455, 67 [Google Scholar]
- Morel, T., Butler, K., Aerts, C., et al. 2006, A&A, 457, 651 [NASA ADS] [CrossRef] [EDP Sciences] [Google Scholar]
- Morel, T., Hubrig, S., & Briquet, M. 2008, A&A 481, 453 [NASA ADS] [CrossRef] [EDP Sciences] [Google Scholar]
- Mucciarelli, A. 2011, A&A, 528, A44 [NASA ADS] [CrossRef] [EDP Sciences] [Google Scholar]
- Negueruela, I., Simon-Diaz, S., Lorenco, J., et al. 2015, A&A 584, A77 [NASA ADS] [CrossRef] [EDP Sciences] [Google Scholar]
- Niemczura, E., Murphy, S. J., Smalley, B., et al. 2015, MNRAS, 450, 2764 [Google Scholar]
- Niemczura, E., Polinska, M., Murphy, S. J., et al. 2017, MNRAS, 470, 2870 [NASA ADS] [CrossRef] [Google Scholar]
- Nieva, M.-F. 2013, A&A 550, A26 [CrossRef] [EDP Sciences] [Google Scholar]
- Nieva, M. F., & Przybilla, N. 2007, A&A, 467, 295 [NASA ADS] [CrossRef] [EDP Sciences] [Google Scholar]
- Nieva, M.-F., & Simon-Diaz, S. 2011, A&A, 532, A2 [CrossRef] [EDP Sciences] [Google Scholar]
- Nieva, M. F., & Przybilla, N. 2012, A&A 539, A145 [NASA ADS] [CrossRef] [EDP Sciences] [Google Scholar]
- Nieva, M. F., & Przybilla, N. 2014, A&A 566, A7 [NASA ADS] [CrossRef] [EDP Sciences] [Google Scholar]
- Palacios, A., Jasniewicz, G., Masseron, T., et al. 2016, A&A, 587, A42 [NASA ADS] [CrossRef] [EDP Sciences] [Google Scholar]
- Pavlenko, Ya. V. 2003, Astron. Rep., 47, 59 [Google Scholar]
- Pavlovski, K., Southworth, J., & Tamajo, E. 2018, MNRAS 481, 3129 [NASA ADS] [Google Scholar]
- Pavlovski, K., Southworth, J., Tkachenko, A., et al. 2023, A&A, 671, A139 [NASA ADS] [CrossRef] [EDP Sciences] [Google Scholar]
- Proxauf, B., da Silva, R., Kovtyukh, V. V., et al. 2018, A&A, 616, A82 [NASA ADS] [CrossRef] [EDP Sciences] [Google Scholar]
- Plez, B. 2012, Astrophysics Source Code Library [record ascl:1205.004] [Google Scholar]
- Przybilla, N., Butler, K., Becker, S. R., & Kudritzki, R.-P. 2001, A&A, 369, 1009 [CrossRef] [EDP Sciences] [Google Scholar]
- Przybilla, N., Butler, K., Becker, S. R., et al. 2006, A&A, 445, 1099 [NASA ADS] [CrossRef] [EDP Sciences] [Google Scholar]
- Przybilla, N., Nieva, M. F., & Butler, K. 2008, ApJ, 688, 10 [Google Scholar]
- Puls, J., Urbaneia, M. A., Venero, R., et al. 2005, A&A, 435, 669 [NASA ADS] [CrossRef] [EDP Sciences] [Google Scholar]
- Putkuri, C., Gamen, R., Morrell, N. L., et al., 2018, A&A, 618, A174 [NASA ADS] [CrossRef] [EDP Sciences] [Google Scholar]
- Ramírez-Agudelo, O. H., Sana, H., de Koter, A., et al. 2017, A&A, 600, A81 [NASA ADS] [CrossRef] [EDP Sciences] [Google Scholar]
- Rivero González, J. G., Puls, J., Najarro, J. F., & Brott, I. 2012, A&A, 537, A79 [NASA ADS] [CrossRef] [EDP Sciences] [Google Scholar]
- Rodriguez, E., & Breger, M. 2001, A&A, 366, 178 [NASA ADS] [CrossRef] [EDP Sciences] [Google Scholar]
- Ryabchikova, T., Piskunov, N. Pakhomov, Yu., et al. 2015, MNRAS, 456, 1221 [Google Scholar]
- Saar, S. H., & Osten, R. A. 1997, MNRAS, 284, 803 [NASA ADS] [CrossRef] [Google Scholar]
- Sabín-Sanjulián, C., Simón-Díaz, S., Herrero, A., et al. 2017, A&A, 601, A79 [NASA ADS] [CrossRef] [EDP Sciences] [Google Scholar]
- Sander, A., Shenar, T., Hainich, R., et al. 2015, A&A 577, A13 [NASA ADS] [CrossRef] [EDP Sciences] [Google Scholar]
- Sander, A. A. C. 2017, IAUS, 329, 215 [Google Scholar]
- Schiller, F., & Przybilla, N. 2008, A&A, 479, 849 [NASA ADS] [CrossRef] [EDP Sciences] [Google Scholar]
- Searle, S. C., Prinja, R. K., Massa, D., et al. 2008, A&A, 481, 777 [NASA ADS] [CrossRef] [EDP Sciences] [Google Scholar]
- Serenelli, A., Weiss, A., Aerts, C., et al. 2021, A&ARv, 29, 4 [Google Scholar]
- Simón-Díaz, S. 2020, in Reviews in Frontiers of Modern Astrophysics (Cham: Springer) [Google Scholar]
- Simón-Díaz, S., & Herrero, A. 2014, A&A 562, A135 [NASA ADS] [CrossRef] [EDP Sciences] [Google Scholar]
- Simón-Díaz, S., Godart, M., Castro, N., et al. 2017, A&A 597, A23 [NASA ADS] [CrossRef] [EDP Sciences] [Google Scholar]
- Schultz, W. C., Bildsten, L., & Jiang, Y.-F. 2020, ApJ, 902, 67 [NASA ADS] [CrossRef] [Google Scholar]
- Schultz, W. C., Bildsten, L., Jiang, Y.-F. 2022, ApJ, 924, 11 [CrossRef] [Google Scholar]
- Schultz, W. C., Bildsten, L., Jiang, Y.-F. 2023, ApJ, 951, 42 [Google Scholar]
- Smalley, B. 2004, in Proceeding IAU Symposium No. 224 [Google Scholar]
- Smalley, B. 2005, Mem. S.A. It. Suppl., 8, 130 [Google Scholar]
- Smartt, S. J., Venn, K. A., Dufton, P. L., et al. 2002, A&A, 367, 86 [Google Scholar]
- Smith, K. C., & Howarth, I. D. 1998, MNRAS, 299, 1146 [Google Scholar]
- Stankov, A., & Handler, G. 2005, ApJS, 158, 193 [NASA ADS] [CrossRef] [Google Scholar]
- Sundqvist, J. O., Simón-Díaz, S., Puls, J., & Markova, N. 2013, A&A, 559, A10 [NASA ADS] [CrossRef] [EDP Sciences] [Google Scholar]
- Takeda, Y. 1995, PASJ, 47, 287 [NASA ADS] [Google Scholar]
- Takeda, Y., & Takada-Hidai, M. 1995, PASJ, 47, 113 [Google Scholar]
- Takeda, Y., & Tajisu, A. 2015, MNRAS, 450, 397 [Google Scholar]
- Takeda, Y., & Ueno, S. 2017 PASJ, 69, 46 [Google Scholar]
- Takeda, Y., Sato, B., Kambe, E., et al. 2005a, PASJ, 57, 109 [Google Scholar]
- Takeda, Y., Ohkubo, M., Sato, B., et al. 2005b, PASJ, 57, 27 [Google Scholar]
- Takeda, Y., Han, I., Kang, D.-I., et al. 2008, J. KAS, 41, 83 [Google Scholar]
- Townsend, R., Owocki, S. P., & Ud-Doula, A. 2007, MNRAS, 382, 139 [NASA ADS] [CrossRef] [Google Scholar]
- Thygesen, A. O., Sbordone, L., Andrievsky, S., et al. 2015, A&A, 572, A108 [Google Scholar]
- Tkachenko, N., Pavlovski, K., Johnston, C., et al. 2020, A&A, 637, A60 [NASA ADS] [CrossRef] [EDP Sciences] [Google Scholar]
- Trundle, C., Dufton, P. L., Hunter, I., et al. 2007, A&A, 471, 625 [NASA ADS] [CrossRef] [EDP Sciences] [Google Scholar]
- Uytterhoeven, K., Moya, A., Grigahcéne, A., et al. 2011, A&A, 534, A125 [NASA ADS] [CrossRef] [EDP Sciences] [Google Scholar]
- Venn, K. 1995, ApJSS, 99, 659 [Google Scholar]
- Verdugo, E., Talavera, A., & Gómez de Castro, A. I. 1999, A&A, 346, 819 [NASA ADS] [Google Scholar]
- Vranken, M., Lennon, D. J., Dufton, P. L., & Lambert, D. L. 2000, A&A, 358, 639 [Google Scholar]
- Wang, Y., Primas, F., Charbonnel, C., et al. 2017, A&A, 607, A135 [NASA ADS] [CrossRef] [EDP Sciences] [Google Scholar]
- Waelkens, C. 1991, A&A, 246, 453 [NASA ADS] [Google Scholar]
Wolf–Rayet stars and Luminous Blue Variables were excluded due to their complex physics and lack of reliable vmic diagnostics.
An analogue of the classical HR diagram where stellar luminosity is replaced by the quantity ℒ/ℒ⊙ = Teff 4/g, effectively representing the luminosity-to-mass ratio.
Systematic uncertainties here refer to those arising from different modelling approaches employed to determine Teff, log g, and vmic.
Q = (U – B) – 0.72(B – V); [c1] = c1 – 0.20(b – y); β measures the intensity (equivalent width) of the Hβ line.
These calibrations typically do not account for gravity-dependent effects in the spectral energy distribution, which become significant in extended atmospheres of hot, massive stars.
Significant errors can also emerge from variations in the number of lines used and the balance between weak and strong transitions; however, these errors are challenging to quantify and control.
For early B-stars, O II lines can also serve as diagnostics; however, see the remarks by Hunter et al (2007).
We acknowledge that some objects might overlap across different datasets.
In a few cases, this analysis was complicated by substantial scatter in the data or by a limited number of stars with reliably determined stellar properties.
For stars with Minit ≥ 40 M⊙, this LC classification is admittedly a simplification.
Although more massive and evolved stars are also known to exhibit pulsational instability (see, e.g., Godart et al. 2017; Haucke et al 2018, and references therein), we focus here on intermediate- and low-mass non-radial pulsators on the main sequence to simplify the analysis.
Stars with Minit ~3–8 M⊙ may experience blue loop evolution, so those with similar Teff and log g may be at different evolutionary stages.
These models were computed by one of us (LG), following the methodology of Grassitelli et al. (2015a) but including the effects of rotation at Vrot (init) = 300 km s−1.
![Mathematical equation: $\[\Delta \log ~g=\log \left(1+\frac{v_{\text {mic }}^{2} \mu 60.5}{T_{\text {eff }}}\right)\]$](/articles/aa/full_html/2025/09/aa54907-25/aa54907-25-eq44.png) with μ ≈ 0.6 (Dr. J. Puls, priv. comm.; see also González-Torà et al. 2025).
with μ ≈ 0.6 (Dr. J. Puls, priv. comm.; see also González-Torà et al. 2025).
As the presence of a positive gradient in atmospheric vmic (r) has not been accounted for, these estimates should be considered as lower limits.
Note: in all these works, optical observations combined with FW or CMFGEN modelling and rotating models from Ekström et al. (2012) and Brott et al. (2011) were consistently used.
We chose this work as a reference because: (i) it is the first and so far only study where the effects of using different codes, evolutionary tracks, and types of diagrams have been systematically assessed in investigating the correspondence between Mspec and Mevol; (ii) all targets analysed in it are included in our database, enabling a direct comparison.
e.g., shock formation affecting the energy balance in outer layers; shock-driven wind components complementing line-driven winds; small-scale density perturbations that may result in clumping, porosity, or altered ionisation balance.
To account for recent results from Bailey et al. (2015), theoretical predictions based on two significantly different metal opacities – from the Opacity Project (Miglio et al. 2007) and with Fe and Ni opacity increased by 75% each (Moravveji 2016) have been both considered in our study.
To estimate the expected vmic for RSGs, the log g–vmic relationship for the RG sample was approximated by a linear regression of the form vmic=1.94(±0.06) – 0.22(±0.03)×log g.
All Tables
Statistical properties of photospheric micro-turbulence of the sample non-pulsating stars separated by SpT and LC.
Statistical properties of photospheric micro-turbulence of the sample non-radial pulsators separated by the type of oscillations and of the classical Cepheids and red giants and supergiants divided into two mass-luminosity subgroups.
Micro-turbulence and the deficit of slow rotators for Galactic stars of various parameters separated by spectral type (OBAFGK), luminosity class (dw – dwarfs; g – giants; sg – supergiants) and initial stellar mass: Group 1 – Minit ≳15 M⊙; Group 2 – 8 M⊙ ≲Minit ≲15 M⊙; Group 3 – 3 M⊙ ≲Minit ≲8 M⊙; Group 4 – 3 M⊙ ≲Minit ≲1 M⊙.
Micro-turbulence and the upper detectability limit to macro-turbulent broadening for Galactic stars of various parameters separated by spectral type (OBAFG), luminosity class (dw – dwarfs; g – giants; sg –supergiants) and initial stellar mass: Group 1 – Minit ≳15 M⊙; Group 2 − 8 M⊙ ≲Minit ≲15 M⊙; Group 3 − 3 M⊙ ≲Minit ≲8 M⊙ and Group 4 − 3 M⊙ ≲Minit ≲1 M⊙.
Model atmosphere and radiative transfer codes used as a source of Teff, log g and vmic data for the sample stars
Overview of the sample stars with photometric Teff and log g determinations and details regarding the corresponding analysis.
Overview of the sample stars with spectroscopically derived properties and details regarding the corresponding analysis.
All Figures
|
Fig. 1 Distribution of the sample stars by spectral type and luminosity class (LC V/IV – red; LC III – light blue; LC II/I – grey) and by the type of pulsations. Upper panel: non pulsating stars. Lower panel: sample pulsators. In both cases the shaded areas indicate the number of objects with photometric Teff and log g determinations. |
| In the text | |
|
Fig. 2 Spectroscopic HRD of the sample stars with data-points colour-coded and size-scaled according to their vmic value, as indicated in the legend. Overplotted, we have the Brott et al. (2011) evolutionary tracks for single stars with solar metallicity and initial rotational velocity Vrot = 300 km s−1; the Eddington limit (horizontal dotted line); the observed HD limit (gray solid thick lines) and the temperature boundaries corresponding to each spectral type (red almost vertical lines). Error bars are omitted for clarity. For more information see Sect. 5. |
| In the text | |
|
Fig. 3 Photospheric micro-turbulence of the sample non-pulsating stars separated by SpT and LC (open circles – LC III/I; solid circles – LC V/IV) as a function of log g (left) and Teff (right). In the top panels over-plotted are: the vmic velocities of a sample of O stars in the SMC derived by means of the CMFGEN code (from Heap et al. 2006), and the theoretical Teff and log g scales of O stars in the MW predicted by Martins et al. (2005a) (red solid (DWs) and dashed (SGs) vertical lines). In each plot, the representative error bars are also indicated. For more information, see Sect. 4. |
| In the text | |
|
Fig. 4 Photospheric micro-turbulence of the sample non-radial pulsators (separated by the type of oscillations), and of the classical Cepheids and red giants and supergiants (symbols highlighted in light and dark blue, respectively) as a function of log g (left) and Teff (right). For the case of non-RPs analogous results for non-pulsating stars of similar Teff, log g and ℒ/ℒ⊙ (colour-coded as indicated in Fig. 3), are also provided for a direct comparison. In each panel the horizontal dashed lines indicate the upper and lower limits to vmic In the left fifth raw panel, the light and dark blue lines represent the mean vmic, averaged within the subgroups of low- and high-mass Cepheids, respectively; in the bottom left panel, the red line indicates the least square fit to vmic of the sample RGs thereby highlighting the deviation of RSGs from this trend. For more information see Appendix A. |
| In the text | |
|
Fig. 5 Photospheric micro-turbulence of the sample stars (pulsating and non-pulsating) as a function of logℒ/ℒ⊙ (=[Teff 4/g]). The data points are colour coded according to their SpT (as indicated in the legend) with slowly pulsating B-stars (SPBs) highlighted in light blue. Vertical lines divide the sample into four spectral luminosity subgroups, depending on the maximum vmic velocity achieved by the corresponding stars (horizontal dotted lines), with the red one indicating the approximate limit between the high and low mass regimes (for more information, see the text). |
| In the text | |
|
Fig. 6 vmic–Teff distribution of the sample stars divided into four spectral luminosity subgroups as defined in Sect. 5.2. Symbols and colours as indicated in the legend with LC V/IV and LC III/I targets highlighted by solid and open circles, respectively. In the top left panel the steep drop in vmic is highlighted by a gray vertical line. For high-mass stars (Minit ≥8 M⊙, Gr. 1&2) the uncertainty in the determination of vmic is typically between 1 and 5 km s−1; for low-mass ones (Minit ≤8 M⊙, Gr. 3 & 4) it is generally below 1 km s−1 (for more details, see the text). |
| In the text | |
|
Fig. 7 Spectroscopic HRD with coloured region representing the maximum ratio of turbulent pressure to total pressure in stellar envelopes as derived from 1D stellar evolution models. Over-plotted we have the photospheric micro-turbulent velocities of the sample stars colour-coded as indicated in the legends (preliminary results). |
| In the text | |
|
Fig. 8 Projected rotational rates of Galactic stars of various properties as a function of logℒ/ℒ⊙ (=[Teff 4/g]) with vertical lines dividing the objects into four spectral luminosity subgroups as defined in Sect. 5.2. Different symbols are used to highlight the v sin i determinations which do (solid (DWs) and open (SGs) circles) and do not (small dots surrounded by a ring) account for the effect of macro-turbulent broadening (for more information see Sect. 6.2). |
| In the text | |
|
Fig. 9 Micro-turbulent velocity of the sample stars separated by spectral luminosity (Gr.1–4), and by SpT and LC (same symbols and colours as in Fig. 3 with SPBs highlighted by a blue five-pointed star). Overplotted in gray are the adopted v sin i (same symbols as in Fig. 8). In each panel the horizontal solid and dashed lines indicate, respectively, the mean value of the upper detectability limit to v sin i averaged “by eye”, and the corresponding |
| In the text | |
|
Fig. 10 Micro-turbulent velocity of the sample stars, separated by spectral luminosity (Gr. 1 to 4), and by SpT and LC as a function of Teff (same symbols and colours as in Fig. 3). Overplotted in gray are the adopted vmac data with solid and open circles representing LC V/IV and LC III/I objects, respectively. The mean value of the upper detectability limit to vmac averaged ’by eye’ and the corresponding |
| In the text | |
|
Fig. A.1 Same as Fig. 2, but with pulsating stars additionally highlighted as indicated in the legend. The theoretical instability strips for β Cephei and SPBs from Miglio et al. (2007) (dark and light grey shaded areas) and from Moravveji (2016) (red solid and dashed line bordered rectangles), and the instability domain for γ Doradus and δ Scuty variables (from Rodriguez & Breger 2001, light pink shaded area) are also provided for a direct comparison. |
| In the text | |
Current usage metrics show cumulative count of Article Views (full-text article views including HTML views, PDF and ePub downloads, according to the available data) and Abstracts Views on Vision4Press platform.
Data correspond to usage on the plateform after 2015. The current usage metrics is available 48-96 hours after online publication and is updated daily on week days.
Initial download of the metrics may take a while.