Fig. 2
Download original image
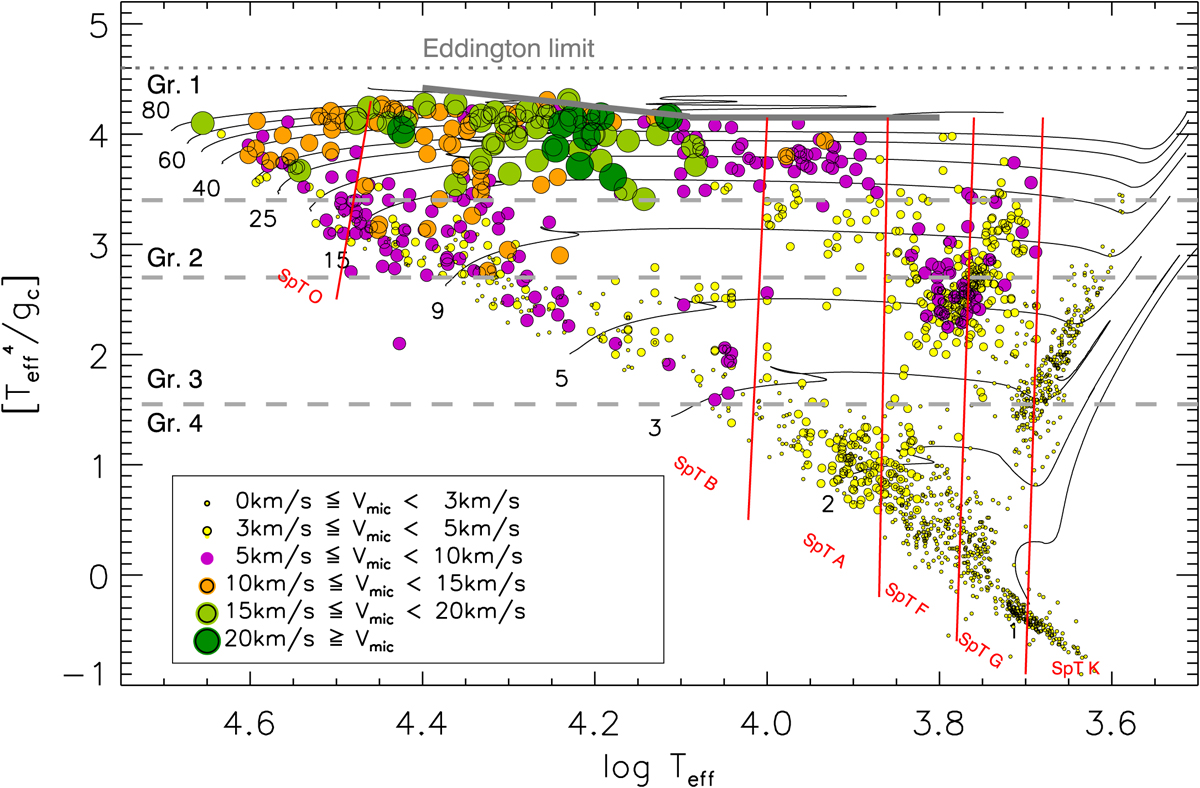
Spectroscopic HRD of the sample stars with data-points colour-coded and size-scaled according to their vmic value, as indicated in the legend. Overplotted, we have the Brott et al. (2011) evolutionary tracks for single stars with solar metallicity and initial rotational velocity Vrot = 300 km s−1; the Eddington limit (horizontal dotted line); the observed HD limit (gray solid thick lines) and the temperature boundaries corresponding to each spectral type (red almost vertical lines). Error bars are omitted for clarity. For more information see Sect. 5.
Current usage metrics show cumulative count of Article Views (full-text article views including HTML views, PDF and ePub downloads, according to the available data) and Abstracts Views on Vision4Press platform.
Data correspond to usage on the plateform after 2015. The current usage metrics is available 48-96 hours after online publication and is updated daily on week days.
Initial download of the metrics may take a while.