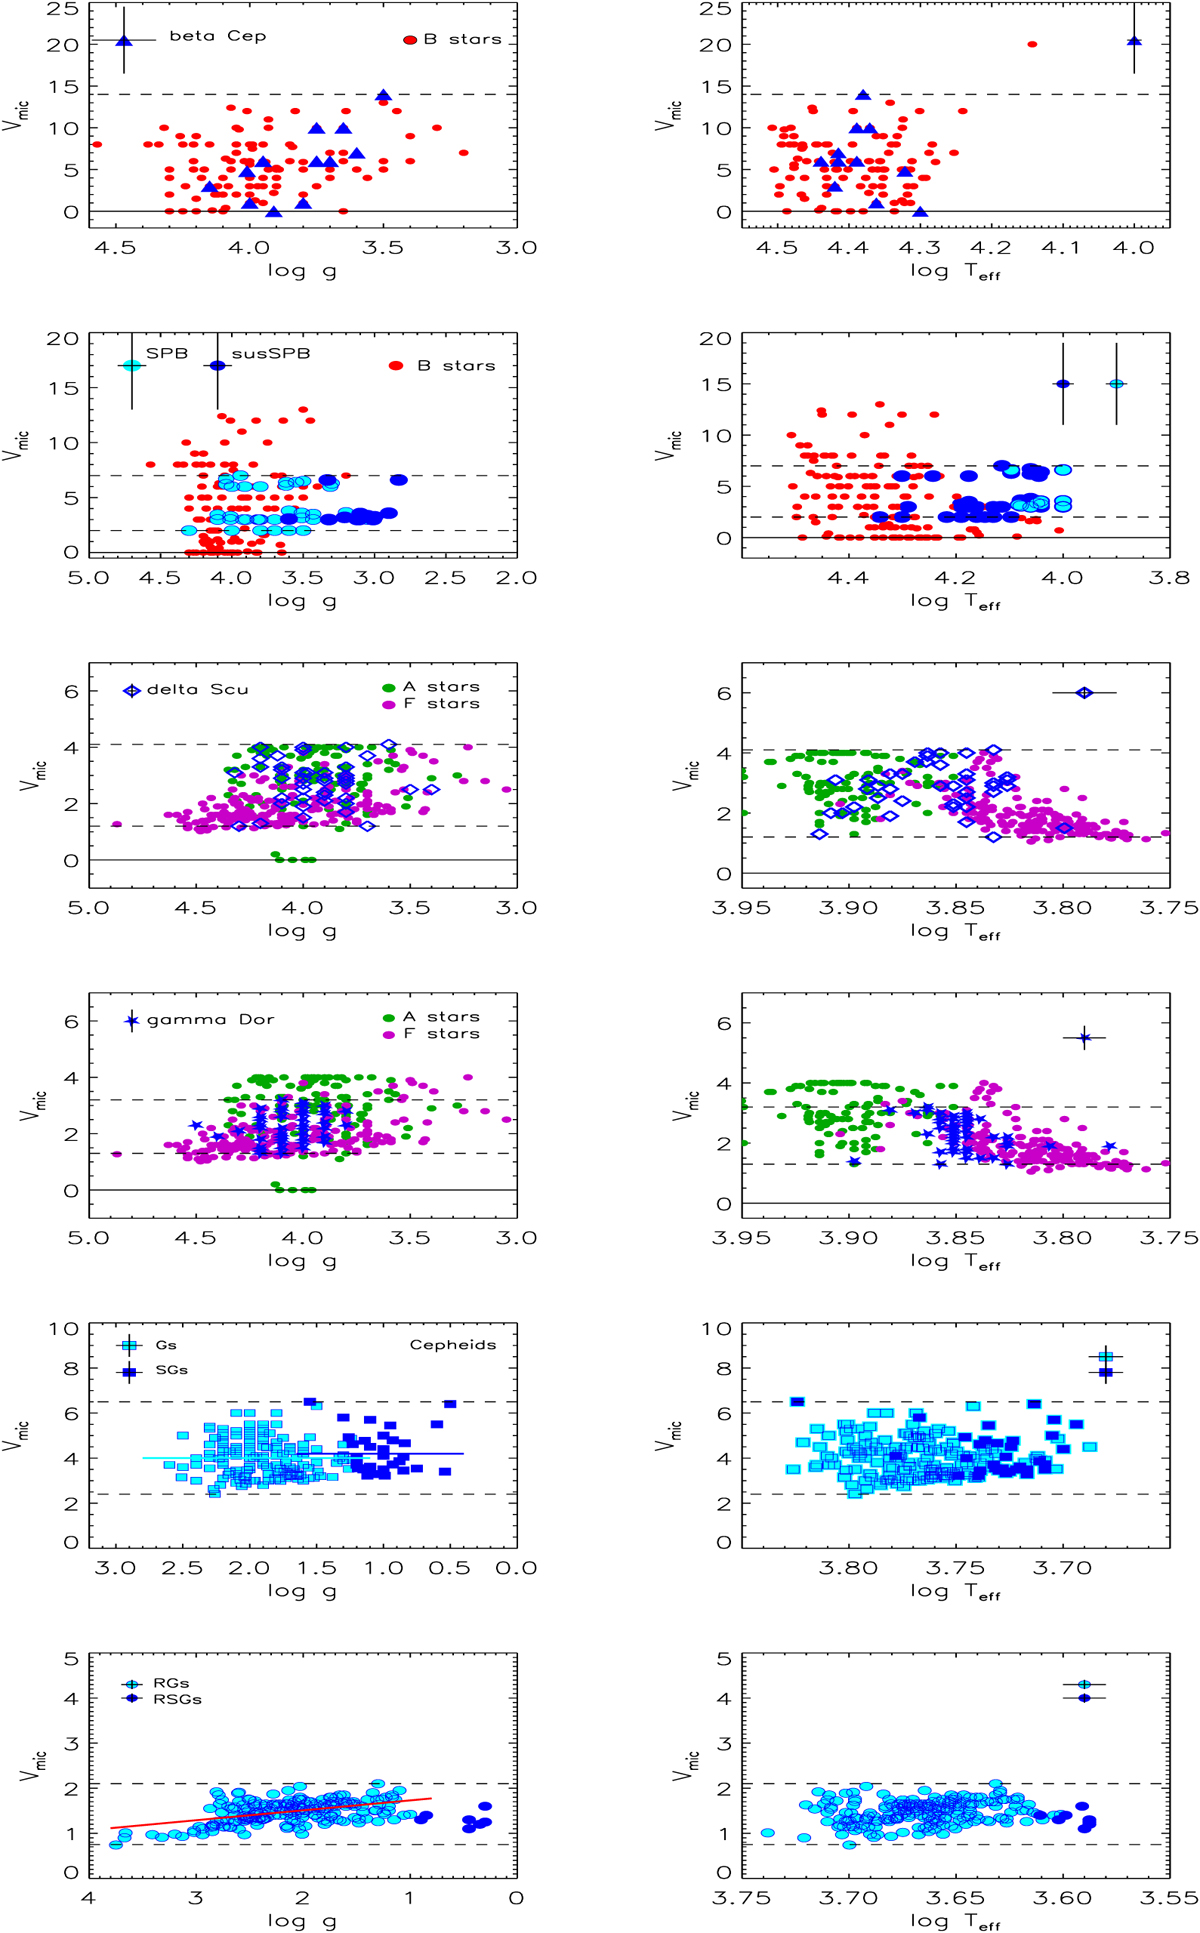
Fig. 4
Download original image
Photospheric micro-turbulence of the sample non-radial pulsators (separated by the type of oscillations), and of the classical Cepheids and red giants and supergiants (symbols highlighted in light and dark blue, respectively) as a function of log g (left) and Teff (right). For the case of non-RPs analogous results for non-pulsating stars of similar Teff, log g and ℒ/ℒ⊙ (colour-coded as indicated in Fig. 3), are also provided for a direct comparison. In each panel the horizontal dashed lines indicate the upper and lower limits to vmic In the left fifth raw panel, the light and dark blue lines represent the mean vmic, averaged within the subgroups of low- and high-mass Cepheids, respectively; in the bottom left panel, the red line indicates the least square fit to vmic of the sample RGs thereby highlighting the deviation of RSGs from this trend. For more information see Appendix A.
Current usage metrics show cumulative count of Article Views (full-text article views including HTML views, PDF and ePub downloads, according to the available data) and Abstracts Views on Vision4Press platform.
Data correspond to usage on the plateform after 2015. The current usage metrics is available 48-96 hours after online publication and is updated daily on week days.
Initial download of the metrics may take a while.