Fig. 6
Download original image
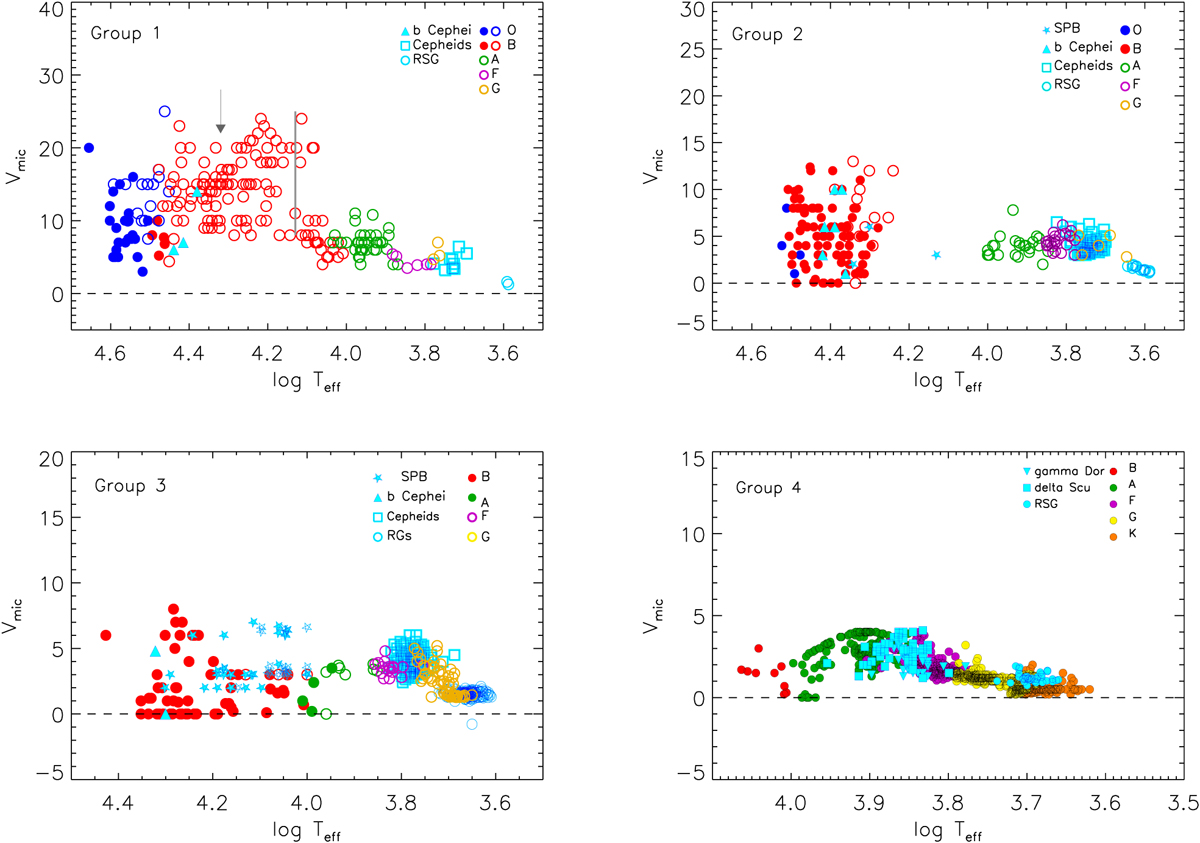
vmic–Teff distribution of the sample stars divided into four spectral luminosity subgroups as defined in Sect. 5.2. Symbols and colours as indicated in the legend with LC V/IV and LC III/I targets highlighted by solid and open circles, respectively. In the top left panel the steep drop in vmic is highlighted by a gray vertical line. For high-mass stars (Minit ≥8 M⊙, Gr. 1&2) the uncertainty in the determination of vmic is typically between 1 and 5 km s−1; for low-mass ones (Minit ≤8 M⊙, Gr. 3 & 4) it is generally below 1 km s−1 (for more details, see the text).
Current usage metrics show cumulative count of Article Views (full-text article views including HTML views, PDF and ePub downloads, according to the available data) and Abstracts Views on Vision4Press platform.
Data correspond to usage on the plateform after 2015. The current usage metrics is available 48-96 hours after online publication and is updated daily on week days.
Initial download of the metrics may take a while.