Open Access
Fig. 7
Download original image
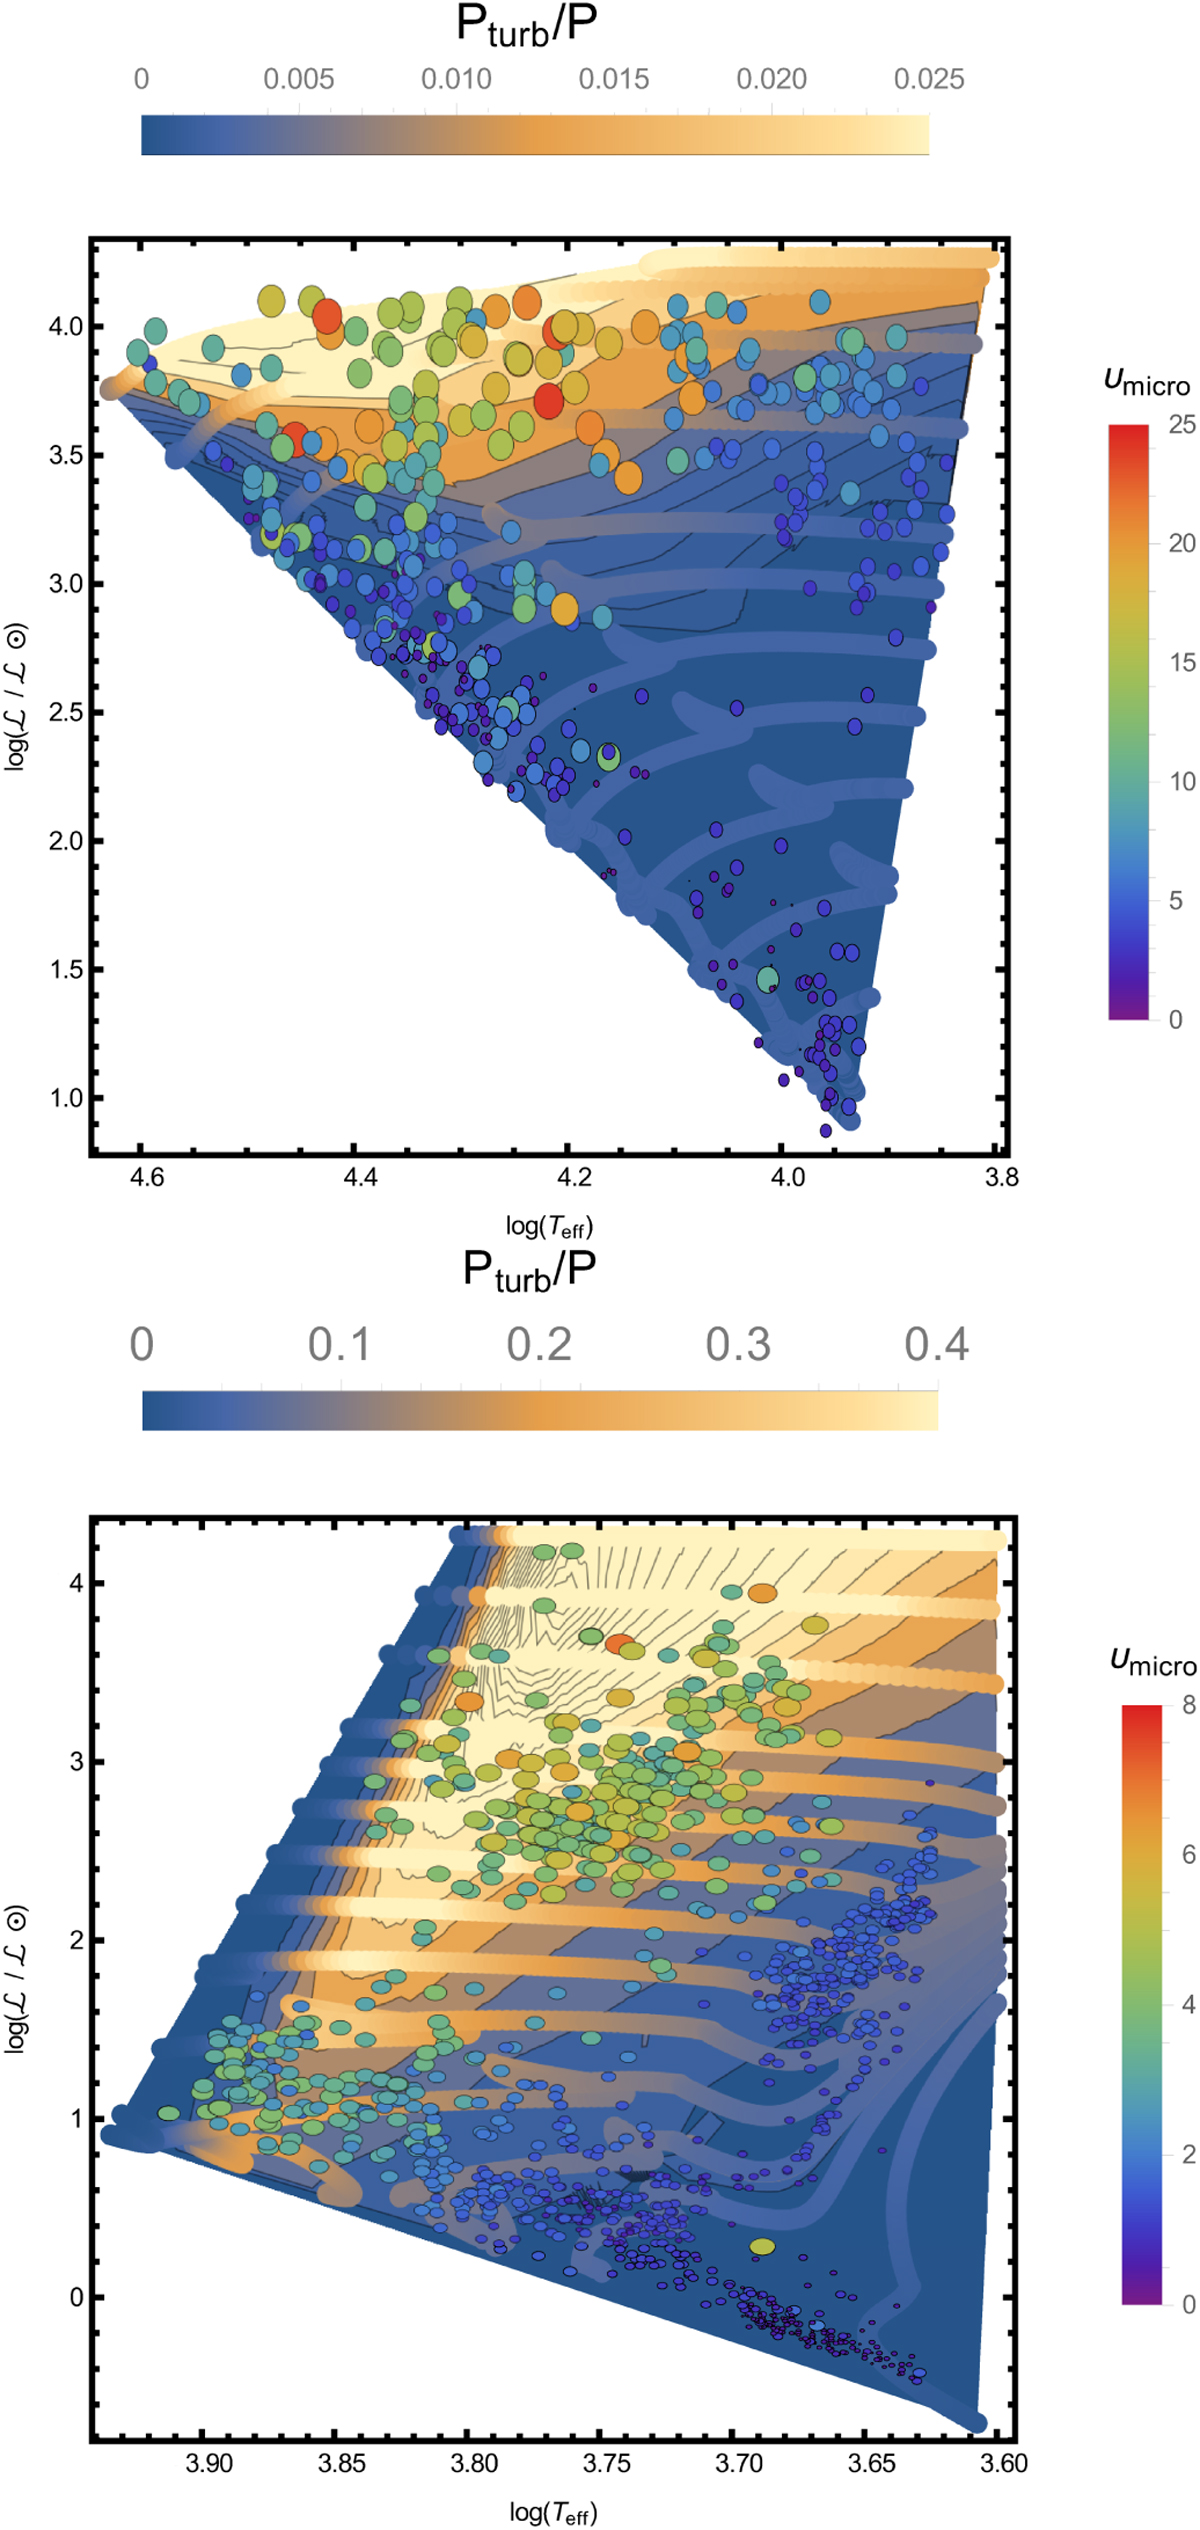
Spectroscopic HRD with coloured region representing the maximum ratio of turbulent pressure to total pressure in stellar envelopes as derived from 1D stellar evolution models. Over-plotted we have the photospheric micro-turbulent velocities of the sample stars colour-coded as indicated in the legends (preliminary results).
Current usage metrics show cumulative count of Article Views (full-text article views including HTML views, PDF and ePub downloads, according to the available data) and Abstracts Views on Vision4Press platform.
Data correspond to usage on the plateform after 2015. The current usage metrics is available 48-96 hours after online publication and is updated daily on week days.
Initial download of the metrics may take a while.