Fig. 4
Download original image
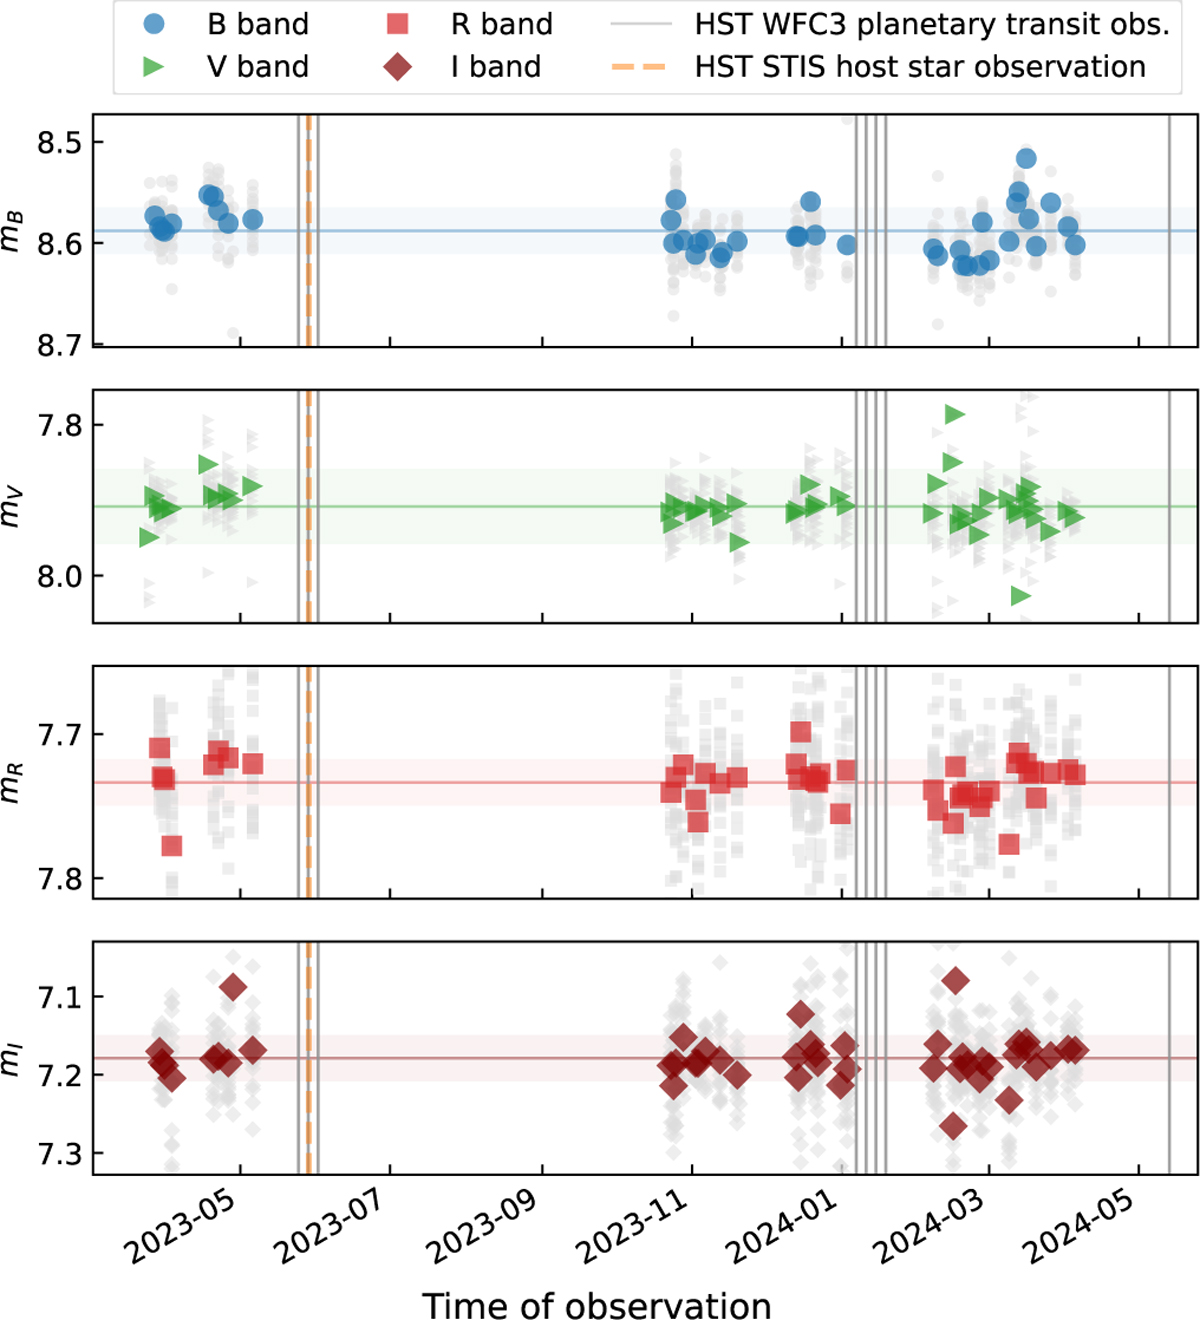
Ground-based photometric monitoring light curve of HD 86226. The large colored markers represent nightly mean magnitudes. The small gray markers represent individual exposures. The sigma-clipped mean magnitudes averaging the entire light curves and the ±1 σall ranges are represented with horizontal lines and shaded regions. Vertical lines correspond to HST observations; the last HST visit in January 2025 is not shown. We identify no evidence of stellar activity during the monitoring period.
Current usage metrics show cumulative count of Article Views (full-text article views including HTML views, PDF and ePub downloads, according to the available data) and Abstracts Views on Vision4Press platform.
Data correspond to usage on the plateform after 2015. The current usage metrics is available 48-96 hours after online publication and is updated daily on week days.
Initial download of the metrics may take a while.