Fig. 5
Download original image
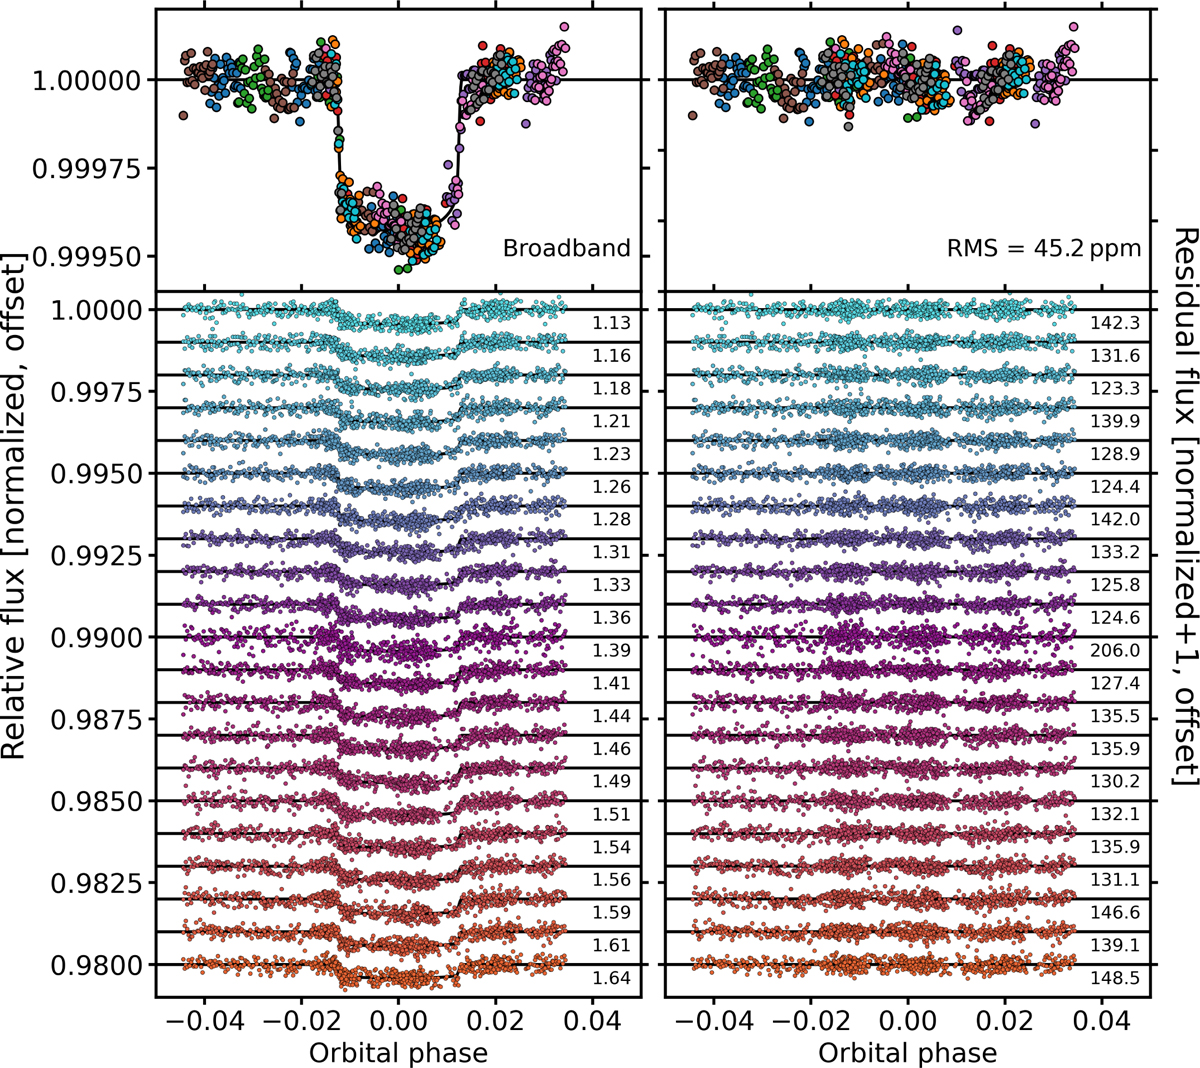
Broadband (top panel) and spectroscopic (bottom panel) light curves obtained with PACMAN by combining all nine observed transits of HD 86226 c. Differently colored data points in the broadband light curve mark the respective visits. The right panel shows the residuals from the fit transit model. Numbers in the bottom panel state the wavelength bin in μm (left panel) and the RMS in ppm (right panel).
Current usage metrics show cumulative count of Article Views (full-text article views including HTML views, PDF and ePub downloads, according to the available data) and Abstracts Views on Vision4Press platform.
Data correspond to usage on the plateform after 2015. The current usage metrics is available 48-96 hours after online publication and is updated daily on week days.
Initial download of the metrics may take a while.