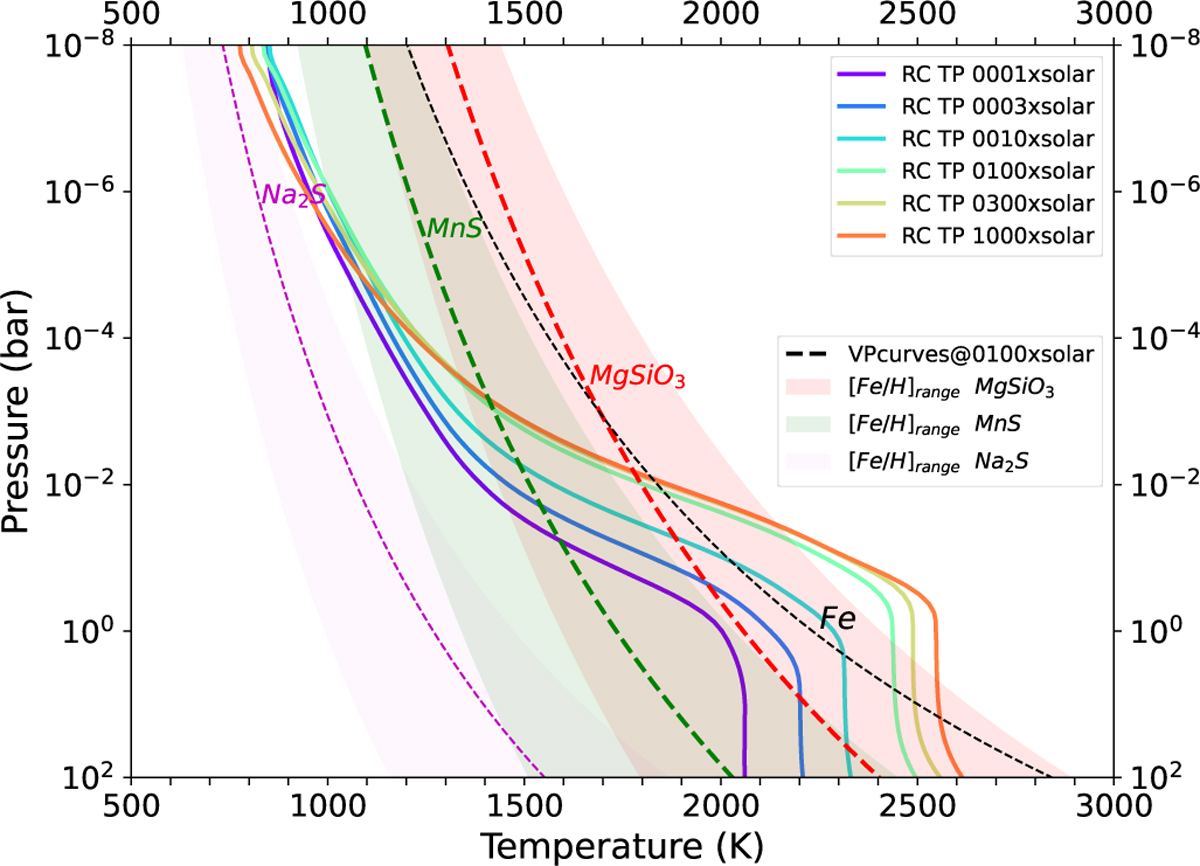
Fig. 8
Download original image
Radiative-convective temperature–pressure profiles and vapor-pressure curves. Solid lines with rainbow colors show radiative-convective temperature profiles for metallicities from 1 to 1000×solar. This figure also shows the vapor–pressure curves of the species we considered in our analysis that could condense on the temperature regimes of HD 86226 c. The vapor-pressure curves at 100× solar atmospheric metallicity are given as dashed lines, while the extent of the vapor-pressure curves over the range of 1 to 1000× solar for MnS, MgSiO3, and Na2S are given as shaded regions. The Fe range is not shown to avoid clutter, as it largely overlaps the MgSiO3 range. Na2S vapor-pressure curves do not cross our temperature-pressure profiles for any atmospheric metallicity. Thus, based on our thermal-stability approach, these clouds could not condense in the atmosphere of HD 86226 c and we did not include them in our analysis.
Current usage metrics show cumulative count of Article Views (full-text article views including HTML views, PDF and ePub downloads, according to the available data) and Abstracts Views on Vision4Press platform.
Data correspond to usage on the plateform after 2015. The current usage metrics is available 48-96 hours after online publication and is updated daily on week days.
Initial download of the metrics may take a while.