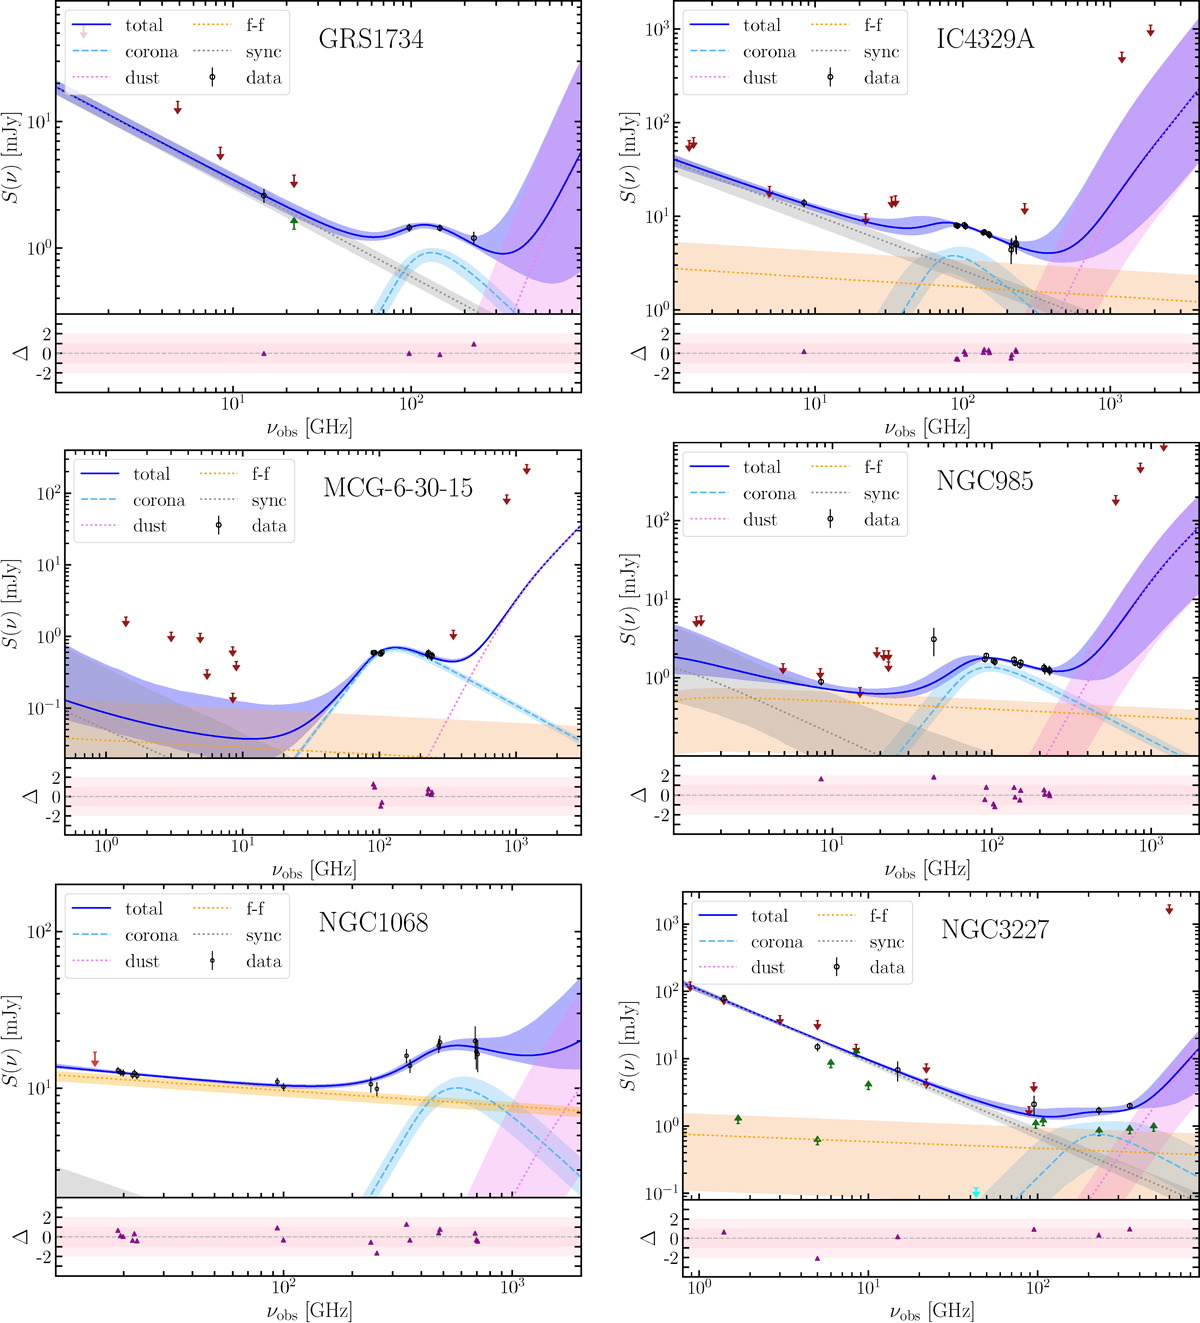
Fig. 5.
Download original image
Multi-frequency SEDs and model fitting of the RQ galaxies in the sample. Data from low-resolution observations were treated as upper limits and are shown with red arrows, and data from very high-resolution observations were treated as lower limits and are shown with green arrows (Sect. 2.2). Further details are provided in Appendix B. For NGC 3227, we also show an upper limit at 43 GHz (cyan arrow) that we did not use in the fitting due to its very high angular resolution, but the compact corona emission should still remain below this value for consistency.
Current usage metrics show cumulative count of Article Views (full-text article views including HTML views, PDF and ePub downloads, according to the available data) and Abstracts Views on Vision4Press platform.
Data correspond to usage on the plateform after 2015. The current usage metrics is available 48-96 hours after online publication and is updated daily on week days.
Initial download of the metrics may take a while.