Fig. 8.
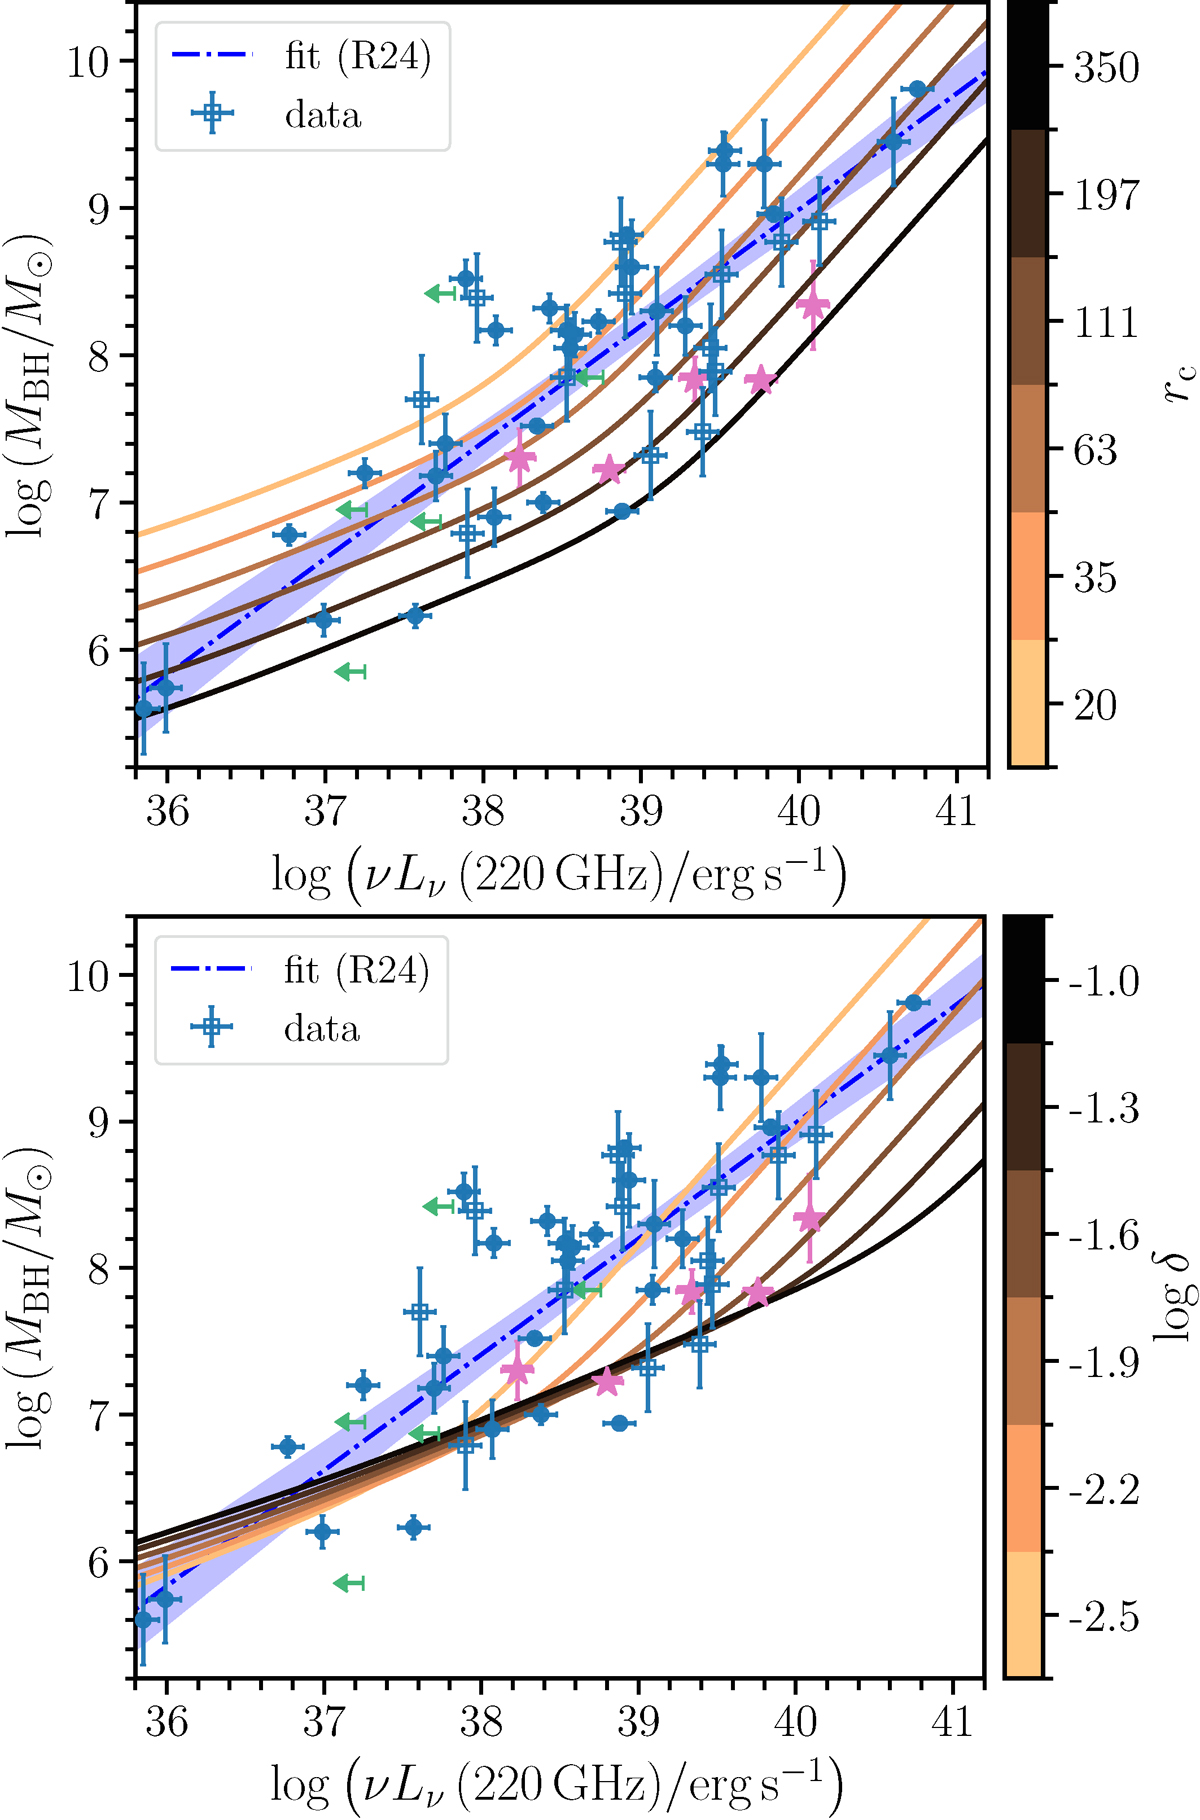
Download original image
Correlation between the luminosity at 220 GHz and the black hole mass. The points and the blue curve are taken from Ruffa et al. (2024); filled circles show sources with dynamical MBH measurements, and open squares represent sources with MBH derived using the MBH–σ⋆ relation (Ruffa et al. 2024). The upper limits are plotted in green for clarity. We also plot the sources we studied with pink stars (except for NGC 3227, which was already included in their sample). The colour-gradient curves are the corona luminosities calculated for the model parameters defined in Sect. 3.1, and using the approximate mean values of rc = 130 and log δ = −2.0 (Sect. 3.3). We explore different values of rc (top panel) and δ (bottom panel), covering the ranges derived for the sources in the sample.
Current usage metrics show cumulative count of Article Views (full-text article views including HTML views, PDF and ePub downloads, according to the available data) and Abstracts Views on Vision4Press platform.
Data correspond to usage on the plateform after 2015. The current usage metrics is available 48-96 hours after online publication and is updated daily on week days.
Initial download of the metrics may take a while.