Fig. 13
Download original image
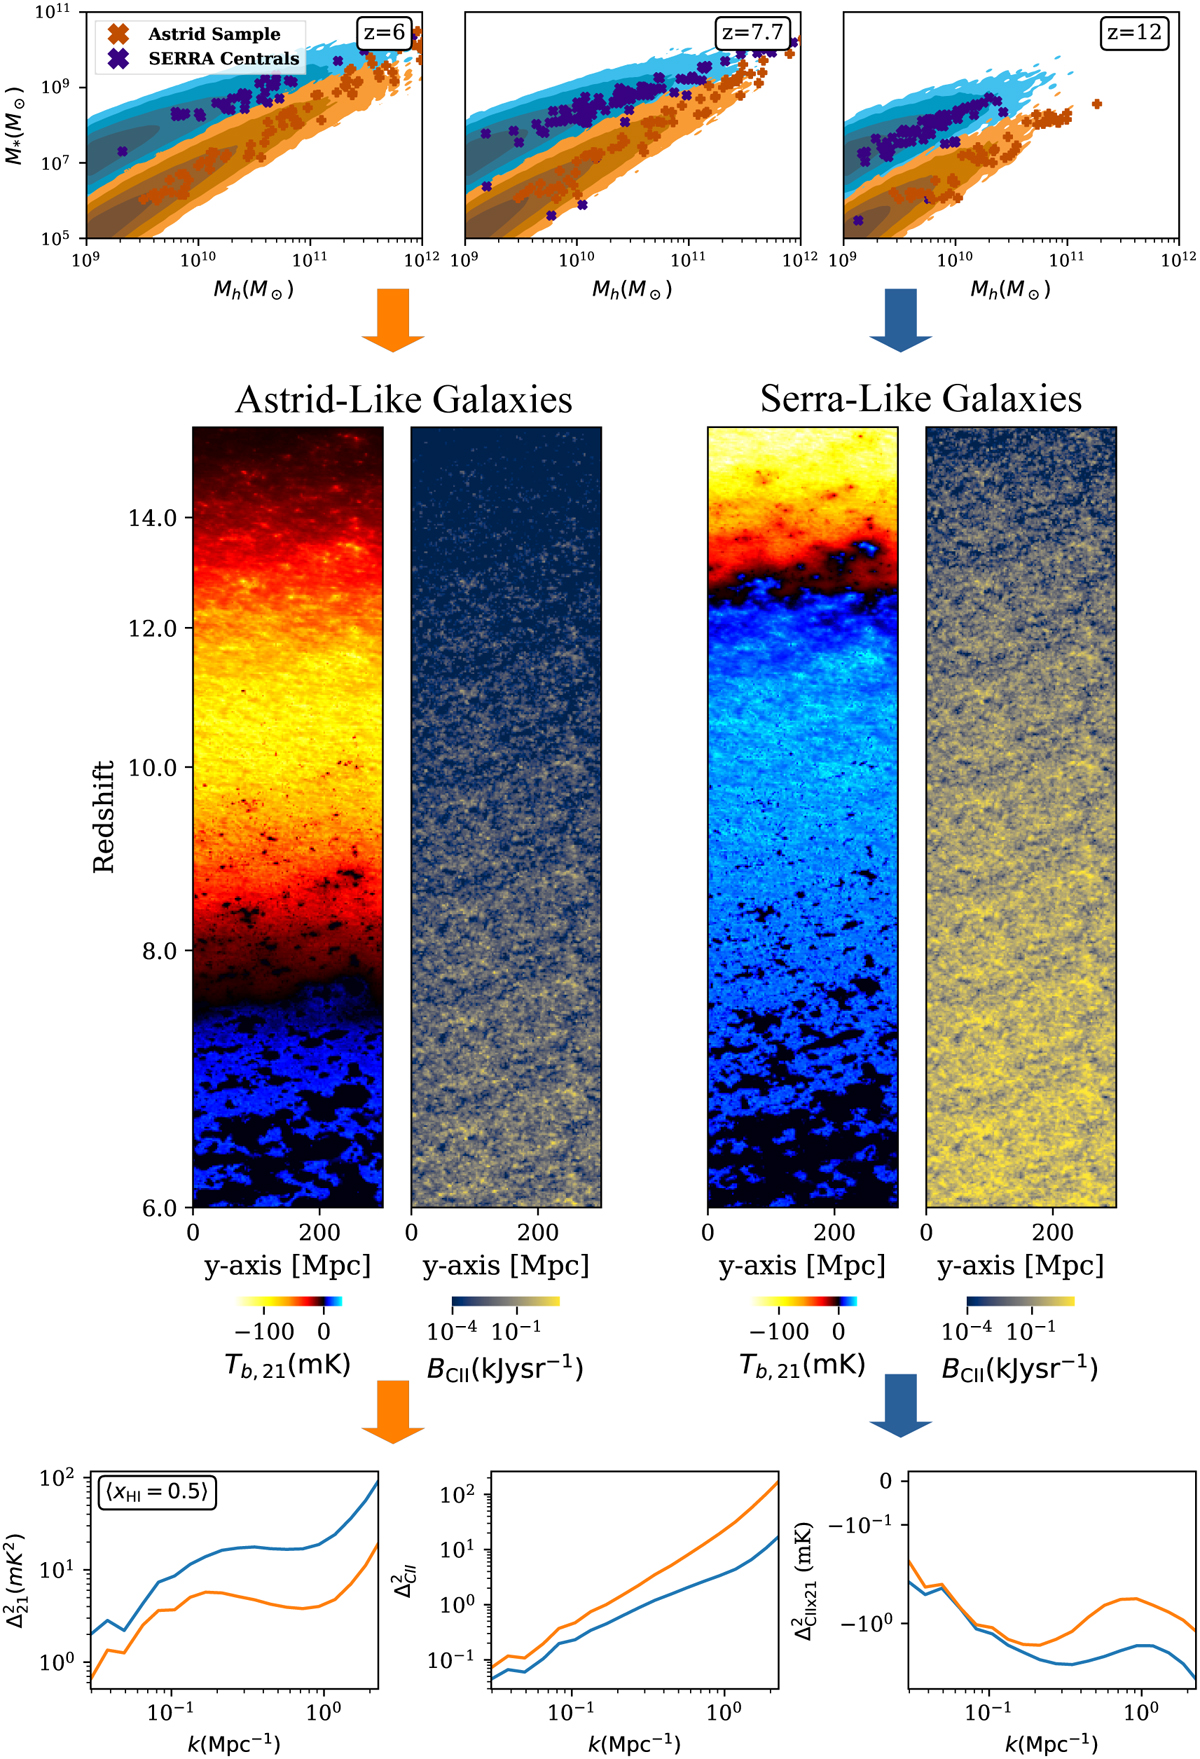
Schematic showing how different galaxy populations affect IGM and LIM observables. Top: SHMR panels from Figure 5, where we set our galaxy scaling relations to be consistent with either the SERRA or Astrid cosmological simulations. Middle: resulting 21cm brightness temperature and CII surface brightness density lightcones in the range 6 < z < 16. Bottom: auto power spectra from both fields, as well as their cross power spectrum at the midpoint of reionisation ![]() . Each galaxy population produces a starkly different CD scenario, easily distinguished by the power spectra of the 21cm and/or CII fields.
. Each galaxy population produces a starkly different CD scenario, easily distinguished by the power spectra of the 21cm and/or CII fields.
Current usage metrics show cumulative count of Article Views (full-text article views including HTML views, PDF and ePub downloads, according to the available data) and Abstracts Views on Vision4Press platform.
Data correspond to usage on the plateform after 2015. The current usage metrics is available 48-96 hours after online publication and is updated daily on week days.
Initial download of the metrics may take a while.