Fig. 2
Download original image
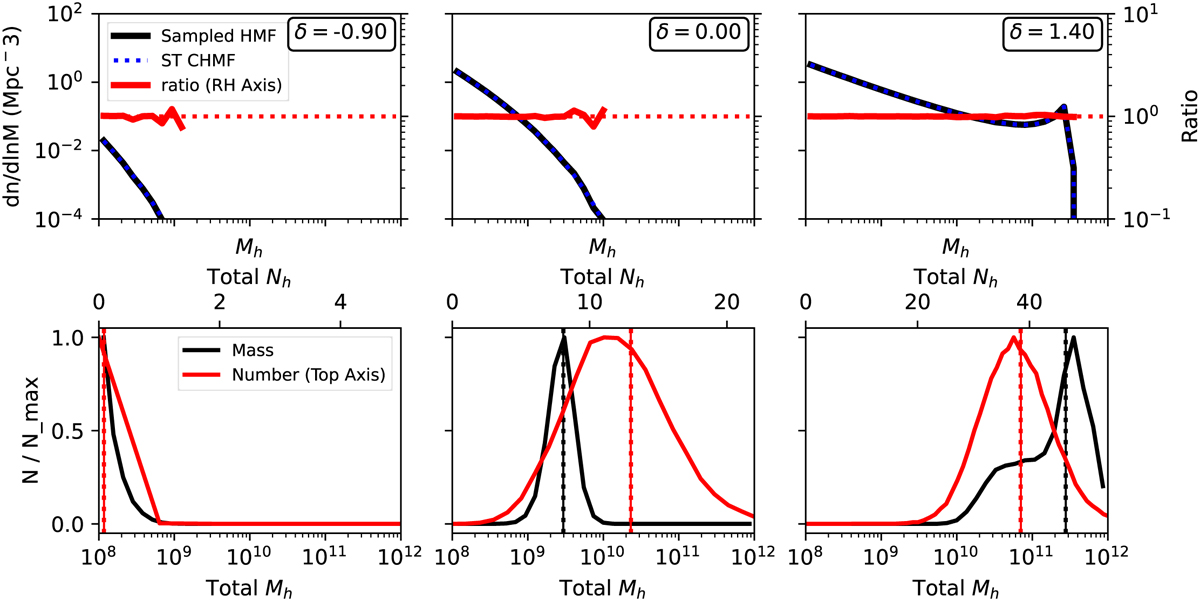
Top: conditional halo mass functions from our sampler at z = 10 (solid black line) and the Sheth-Tormen CHMF (Equation (3), shown as a blue dotted line) in 10 000 under-dense (left, δ = −0.9) mean density (middle, δ = 0.0) and over-dense (right, δ = 1.4) Lagrangian cells of volume (2 Mpc)3 . Their ratio is indicated on the right vertical axis and shown as a solid red line which follows the target of unity (red dotted lines). Bottom: distribution of the number of halos (red curve) and total mass of halos (black curve) within each cell. The average of the distribution and the expected average from the Sheth–Tormen CHMF are shown as solid and dotted vertical lines, respectively. The agreement between the mean computed from samples and the target mean is evidenced by the overlapping solid and dotted lines.
Current usage metrics show cumulative count of Article Views (full-text article views including HTML views, PDF and ePub downloads, according to the available data) and Abstracts Views on Vision4Press platform.
Data correspond to usage on the plateform after 2015. The current usage metrics is available 48-96 hours after online publication and is updated daily on week days.
Initial download of the metrics may take a while.