Fig. 4
Download original image
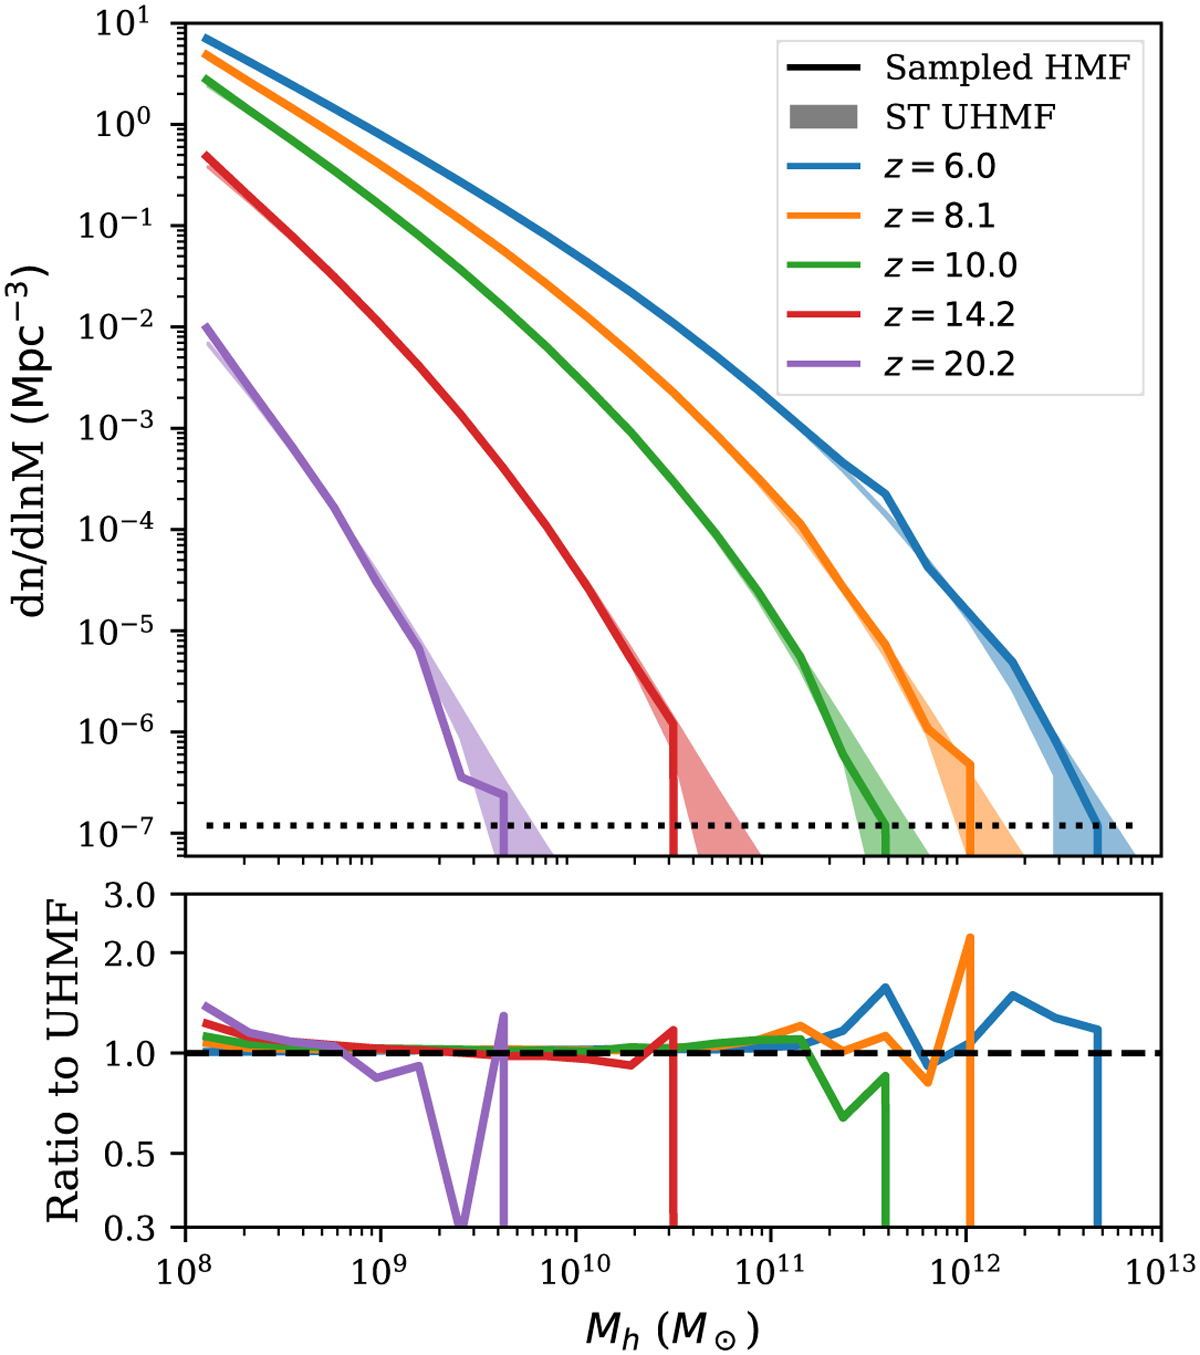
Correlated sampling of halos from z = 6 to z = 30 within a 300 cMpc box. Top: total halo mass function within the box at from redshifts z = 6 to z = 30, compared to the Sheth-Tormen unconditional mass function represented as a shaded region with Poisson uncertainty. The black dotted line corresponds to a number density of one halo in the simulation volume within that bin. Bottom: ratio of the sampled mass function to the expected Sheth–Tormen unconditional mass function, showing an excess of small halos at the highest redshifts, but remaining within Poisson errors over the vast majority of masses and redshifts.
Current usage metrics show cumulative count of Article Views (full-text article views including HTML views, PDF and ePub downloads, according to the available data) and Abstracts Views on Vision4Press platform.
Data correspond to usage on the plateform after 2015. The current usage metrics is available 48-96 hours after online publication and is updated daily on week days.
Initial download of the metrics may take a while.