Fig. 5
Download original image
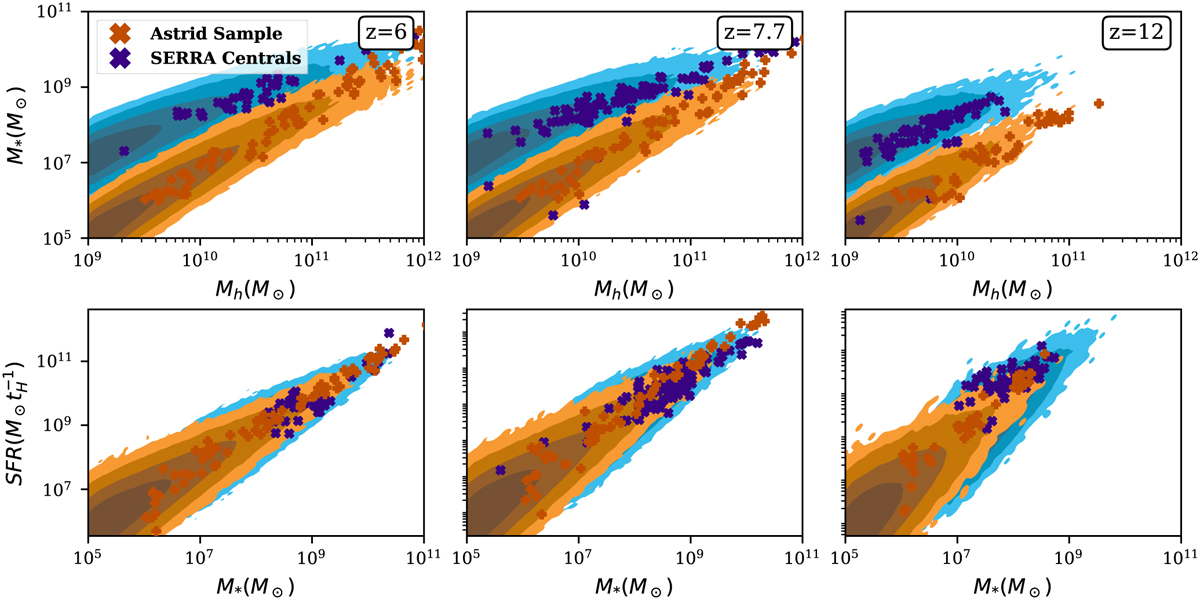
Distributions of stellar to halo mass (top) and star formation rate to stellar mass (bottom) at z = (6.0,7.7,12). Orange and blue points correspond to galaxies taken from two hydrodynamical simulations: the zoom-in simulation suite SERRA (Pallottini et al. 2022) and the large cosmological simulation Astrid (Bird et al. 2022). For the SERRA sample we plot every central galaxy at these redshifts, while for Astrid we plot a subsample randomly selected in fixed logarithmic mass bins. Both codes have been calibrated to reproduce observable data at Mh ≳ 1012M⊙, but predict very different SHMRs for the unseen, faint galaxies that dominate the EoR and CD. The orange and blue contours correspond to two different parameter combinations in 21cmFASTv4 whose conditional distributions can characterise the correspondingly-coloured galaxy populations from the different hydro codes. These contours correspond to 2-5 σ of the joint distributions, P(M*, Mh) and P(SFR, M*), highlighting how the vast majority of galaxies are expected to be far below the resolution limits for large-scale cosmological simulations. This figure demonstrates that our semi-empirical model is flexible, capable of capturing a large range of predictions, and eventually allowing us to infer such galaxy properties from multi-tracer galaxy and IGM observations.
Current usage metrics show cumulative count of Article Views (full-text article views including HTML views, PDF and ePub downloads, according to the available data) and Abstracts Views on Vision4Press platform.
Data correspond to usage on the plateform after 2015. The current usage metrics is available 48-96 hours after online publication and is updated daily on week days.
Initial download of the metrics may take a while.