Fig. 6
Download original image
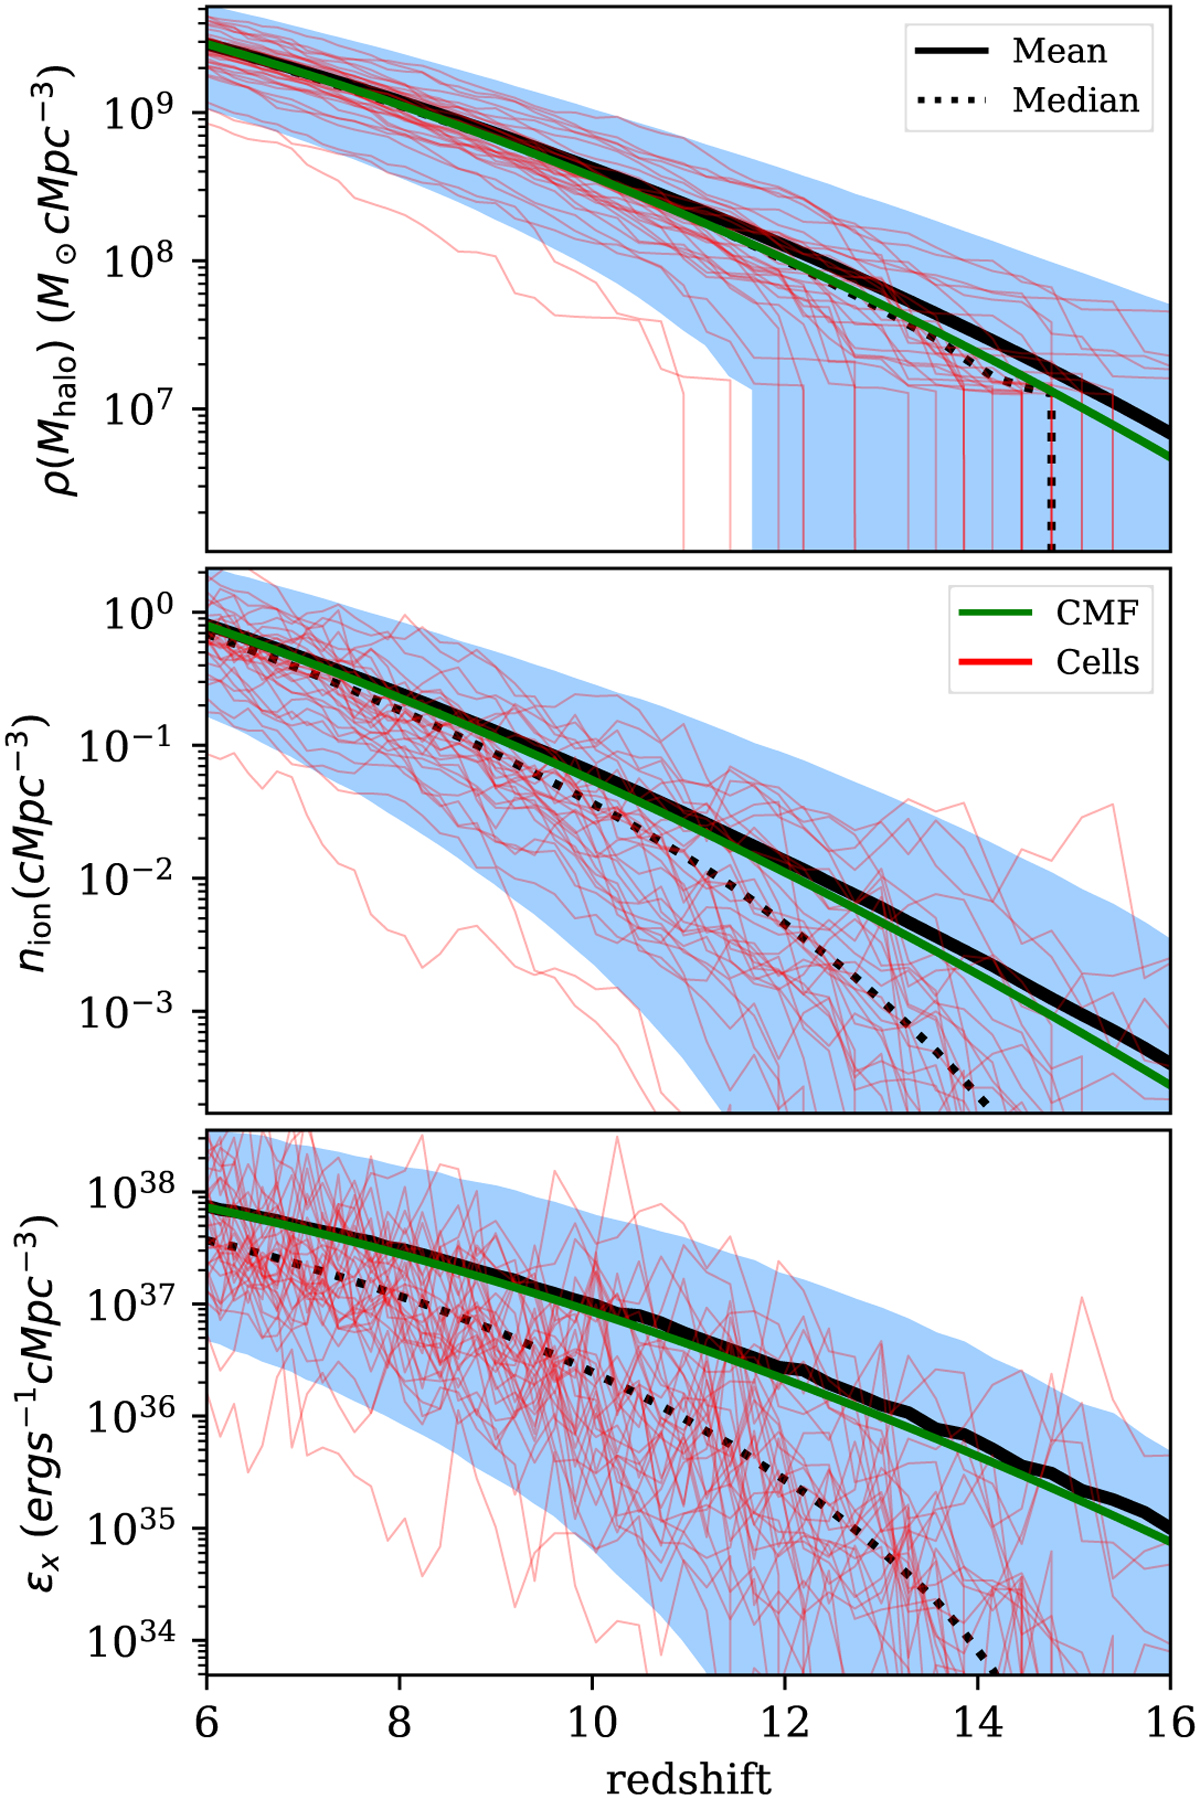
Galaxy properties within 323 Lagrangian cells with side length 2 Mpc at exactly mean density (δcond = 0), including stochastically sampled halos above 108 M⊙ showing the variance in galaxy properties solely from the sampling of halo populations and galaxy properties. We show halo mass density (top), cumulative ionising photon density per hydrogen atom (middle) and X-ray soft-band emissivity (bottom). Solid and dotted black lines show the mean and median of the distribution respectively, and green lines show the expected mean obtained by integrating the CHMF. Blue shaded regions span the [2.5, 97.5] percentile range, and the thin red lines show 32 randomly selected individual cells. Changes over time in the summed galaxy properties are caused by the growth of halos, as well as the variability in the stellar to halo mass ratio and specific star formation rate.
Current usage metrics show cumulative count of Article Views (full-text article views including HTML views, PDF and ePub downloads, according to the available data) and Abstracts Views on Vision4Press platform.
Data correspond to usage on the plateform after 2015. The current usage metrics is available 48-96 hours after online publication and is updated daily on week days.
Initial download of the metrics may take a while.