Fig. 7
Download original image
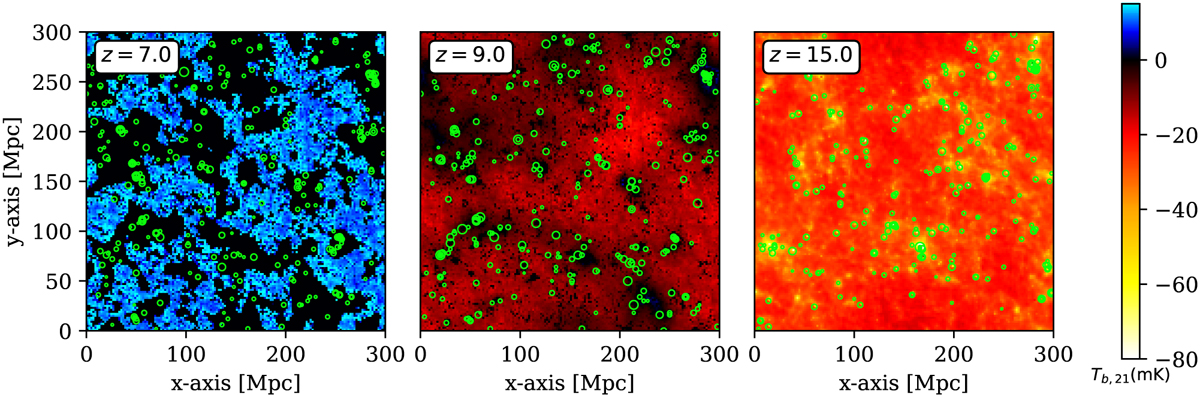
Co-location of galaxies and the 21cm brightness temperature fields in our illustrative simulation during key stages in the history of the CD and EoR. We show slices at z = 14.8, z = 9.0, and z = 7.0, corresponding to epochs of Lyman alpha coupling, X-ray heating, and reionisation, respectively. Green circles denote 200 galaxies with the brightest UV magnitudes in each slice, with larger circles corresponding to brighter galaxies.
Current usage metrics show cumulative count of Article Views (full-text article views including HTML views, PDF and ePub downloads, according to the available data) and Abstracts Views on Vision4Press platform.
Data correspond to usage on the plateform after 2015. The current usage metrics is available 48-96 hours after online publication and is updated daily on week days.
Initial download of the metrics may take a while.