Open Access
Fig. 9.
Download original image
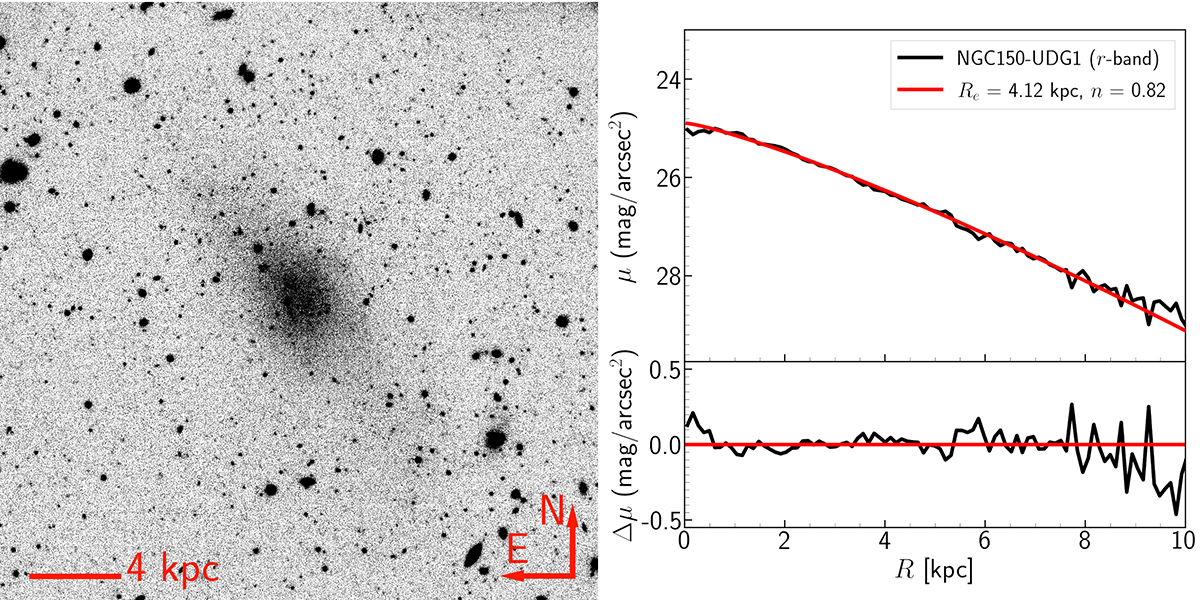
Left panel: Galaxy NGC150-UDG1 in the r-band. Right panel: Light profile (black line) and the best-fit Sérsic profile (red curve) for the galaxy. The corresponding Sérsic parameters of the best-fit function are presented in the top-right of the diagram.
Current usage metrics show cumulative count of Article Views (full-text article views including HTML views, PDF and ePub downloads, according to the available data) and Abstracts Views on Vision4Press platform.
Data correspond to usage on the plateform after 2015. The current usage metrics is available 48-96 hours after online publication and is updated daily on week days.
Initial download of the metrics may take a while.