| Issue |
A&A
Volume 701, September 2025
|
|
|---|---|---|
| Article Number | A182 | |
| Number of page(s) | 20 | |
| Section | Extragalactic astronomy | |
| DOI | https://doi.org/10.1051/0004-6361/202554980 | |
| Published online | 12 September 2025 | |
Stellar tidal streams around nearby spiral galaxies with deep imaging from amateur telescopes
1
Centro de Estudios de Física del Cosmos de Aragón (CEFCA), Unidad Asociada al CSIC, Plaza San Juan 1, 44001 Teruel, Spain
2
ARAID Foundation, Avda. de Ranillas, 1-D, E-50018 Zaragoza, Spain
3
Instituto de Astrofísica de Andalucía, CSIC, Glorieta de la Astronomía, E-18080 Granada, Spain
4
Ruhr University Bochum, Faculty of Physics and Astronomy, Astronomical Institute (AIRUB), 44780 Bochum, Germany
5
Department of Physics, University of Surrey, Guildford GU2 7XH, UK, Departamento de Física de la Tierra y Astrofísica, Universidad Complutense de Madrid, E-28040 Madrid, Spain
6
Instituto de Física de Partículas y del Cosmos (IPARCOS), Universidad Complutense de Madrid, E-28040 Madrid, Spain
7
UAI – Unione Astrofili Italiani /P.I. Sezione Nazionale di Ricerca Profondo Cielo, 72024 Oria, Italy
8
Lund Observatory, Division of Astrophysics, Department of Physics, Lund University, Box 43 SE-221 00 Lund, Sweden
9
Max-Planck Institute for AstronomyKönigstuhl 17 69117 Heidelberg Germany
10
Astronomisches Rechen-Institut, Zentrum für Astronomie der Universität Heidelberg, Mönchhofstr. 12–14, D-69120 Heidelberg, Germany
11
Université de Strasbourg, CNRS, Observatoire astronomique de Strasbourg (ObAS), UMR 7550, F-67000 Strasbourg, France
12
Left Hand Observatory, Boulder, CO, USA
13
Argelander Institut für Astronomie der Universität Bonn, Auf dem Hügel 71, 53121 Bonn, Germany
14
Xinjiang Astronomical Observatory, Chinese Academy of Sciences, 830011 Urumqi, Xinjiang, PR China
15
Max-Planck-Institut für Radioastronomie, Auf dem Hügel 69, 53121 Bonn, Germany
16
Steward Observatory, Department of Astronomy, University of Arizona, 933 N. Cherry Avenue, Tucson, AZ 85748, USA
17
Doc Greiner Research Observatory-Rancho Hidalgo, Animas, New Mexico, USA
18
CHART32, Cerro Tololo Inter-American Observatory (CTIO), Vicuña, Chile
19
Remote Observatories Southern Alpes, Verclause, France
20
Black Bird Observatory II, Alder Springs, California, USA
21
Asociación Astronómica AstroHenares, 28823 Coslada, Madrid, Spain
22
Rancho del Sol Observatory, Camino, California, USA
23
Tivoli Southern Sky Guest Farm, xxxx, Namibia
24
MJ Observatory, Cuenca, Spain
25
Universidad Internacional de Valencia (VIU), C. del Pintor Sorolla 21, 46002 Valencia, Spain
26
Leiden Observatory, Leiden University, P.O. Box 9513 2300 RA Leiden, The Netherlands
⋆⋆ Corresponding author.
Received:
1
April
2025
Accepted:
25
June
2025
Abstract
Context. Tidal interactions between massive galaxies and their satellites are fundamental processes in a universe with a Λ cold dark matter (ΛCDM) cosmology, and they redistribute material into faint features that preserve records of past galactic interactions. While stellar streams in the Local Group impressively demonstrate satellite disruption, they do not constitute a statistically significant sample. Constructing a substantial catalog of stellar streams beyond the Local Group remains challenging due to the difficulties in obtaining sufficiently deep wide-field images of galaxies. Despite their potential to illuminate dark matter distribution and galaxy formation processes overall, stellar streams remain underutilized as cosmological probes.
Aims. The Stellar Tidal Stream Survey (STSS) addresses this observational gap by leveraging amateur telescopes to obtain deep scientific-grade images of galactic outskirts capable of building a more statistically meaningful sample of stellar streams.
Methods. Over the past decade, the STSS has acquired deep (up to surface brightness limit ∼28.3 mag/arcsec2 in the r-band) wide-field images of 16 nearby Milky Way analog galaxies using a coordinated network of robotic amateur telescopes, which enabled the survey to avoid the issues associated with “mosaicking” smaller images taken with a single professional telescope.
Results. Our survey revealed a diverse range of previously unreported faint features related to dwarf satellite accretion, including stellar streams, shells, and umbrella-like structures. We serendipitously discovered an ultra-diffuse galaxy (NGC150-UDG1) that shows hints of tidal tails.
Conclusions. The STSS demonstrates the suitability of modern amateur telescopes to detect and study faint, diffuse structures in large fields around nearby spiral galaxies. Their economic and accessibility advantages enable larger statistical samples with deep imaging, which are essential for testing galaxy formation models and constraining the frequency and properties of minor merger events in the local Universe.
Key words: methods: observational / galaxies: dwarf / galaxies: formation / galaxies: halos / galaxies: interactions
ARAID Fellow.
© The Authors 2025
 Open Access article, published by EDP Sciences, under the terms of the Creative Commons Attribution License (https://creativecommons.org/licenses/by/4.0), which permits unrestricted use, distribution, and reproduction in any medium, provided the original work is properly cited.
This article is published in open access under the Subscribe to Open model. This email address is being protected from spambots. You need JavaScript enabled to view it. to support open access publication.
1. Introduction
While the cosmological models built within the Λ cold dark matter (ΛCDM) paradigm predict a decline in minor merger rates to the present-day epoch (e.g., Bullock & Johnston 2005; Cooper et al. 2010, 2013), they also suggest that satellite disruption remains common around most galaxies, particularly around the more massive ones (Guo & White 2008; Jackson et al. 2022). Consequently, galactic halos should contain numerous diffuse structural features resulting from interactions with dwarf satellites, globular clusters, and numerous dwarf-galaxy sized sub-halos (Johnston et al. 2008). The most spectacular cases include long, dynamically cold stellar streams that wrap around the host galaxy’s disk, isolated shells, jet-like features, giant debris clouds, and large diffuse structures that are old phase-mixed remnants of accreted satellites. Stellar streams have also been found within galaxy clusters, some of which are isolated and have no clear association with a host galaxy (e.g., Mihos et al. 2017; Román et al. 2023).
Comparing the observed frequency and properties of stellar streams with simulations can verify whether the ΛCDM correctly predicts the abundance and structure of tidal features (e.g., Miro-Carretero et al. 2025), thus offering insights into baryonic processes within dark matter halos (e.g., Shipp et al. 2023). Beyond tracing merger histories, characterizing stellar streams around massive galaxies enables valuable tests of N-body simulations of tidal disruption and accretion. These models are constructed by fitting the sky-projected features from deep images, and dynamical analysis of these complex tidal structures offers unique constraints on the dark matter halos and their asymmetries. The primary challenge in modeling streams with imaging data alone is the degeneracy between orbit and inclination. Fortunately, even a few line-of-sight velocity measurements can help break this degeneracy, particularly for multi-wrap streams and measurements from opposite sides of the galaxy (e.g., Walder et al. 2024).
Presently, obtaining radial velocities of hundreds of tidal debris stars with an adequate signal-to-noise (S/N ≧ 20) is challenging with ground-based facilities. However, future surveys with, for instance, the Extremely Large Telescope (ELT; e.g., Padovani & Cirasuolo 2023) and MOSAIC (e.g., Kelz et al. 2016), offer significant promise.
Imaging stellar tidal streams around galaxies is inherently difficult. For nearby systems, their typical surface brightness (SB) is at least 26 mag/arcsec2 or fainter, depending on the progenitor’s luminosity and accretion time (Johnston et al. 2001; Sola et al. 2025). As such, streams around galaxies beyond the Local Group cannot be resolved into individual stars with modest telescopes but instead appear as elongated diffuse light regions extending over several arcminutes on the sky. Identifying low-surface brightness (LSB) features around galaxies requires deep wide-field images with excellent flat-field quality covering extensive regions around target galaxies.
At the beginning of this century, only a few extragalactic stellar tidal streams had been reported in the local Universe. Using special contrast-enhancement techniques on deep photographic plates, Malin & Hadley (1997) first highlighted the tidal features surrounding M83 and M104 (see Martínez-Delgado et al. 2021 for amateur images of M104). The detection of these faint extragalactic stellar streams, together with the simultaneous discovery of the Sagittarius tidal streams wrapping around the Milky Way (Mateo 1997; Ibata et al. 2001; Martínez-Delgado et al. 2001; Majewski et al. 2003), encouraged systematic searches for analogous tidal structures in nearby galactic halos. However, as professional telescopes leveraged the first wide-field cameras, they still suffered from additional challenges when imaging extended LSB features. For several years, their long focal ratios and large flat-field correction errors limited stellar stream discoveries to only a few cases (e.g., Shang et al. 1998; Forbes et al. 2003; Pohlen et al. 2003).
In this context, the Stellar Tidal Stream Survey (STSS) – an innovative professional-amateur (ProAm) collaboration involving astrophotographers worldwide operating robotic telescopes (see Fig. 1) – demonstrated the advantages of small telescopes in detecting LSB features across large sky areas (Martínez-Delgado et al. 2008). During the last two decades, small short-focal-length telescopes with single-chip cameras provided larger fields of view (20–120 arcmin), enabling easier flat fielding of regions around galaxies in comparison to the multi-chip detector arrays used with professional telescopes. Observations using professional telescopes suffered from significant image background variations (e.g., flat-fielding issues for different chips, fringes, scattered light) caused by stitching together multiple pointings to cover the full spatial extent of galactic halos (“mosaicking”). These artifacts complicated faint structure detection (see Tal et al. 2009; Miskolczi et al. 2011), and their correction added significant overhead to data gathering and processing. Finally, the STSS has extended amateur contributions to a new research field related to galaxy formation and evolution, providing unprecedented deep probes of stellar halos in nearby galaxies. The competitive nature of time allocation on professional telescopes makes it difficult to secure the substantial observing time needed for comprehensive surveys of galaxy outskirts, especially when the detection of faint features cannot be guaranteed in advance.
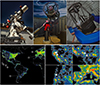 |
Fig. 1. Top row: Three of the amateur telescopes used in STSS: AstroPhysics 0.13-m f/4.5 (left), RCO 0.506-m f/8.1 (center), and CHART32 Cassegrain 0.80-m f/7 (right). Bottom row: Location of the robotic telescope facilities used in STSS (see Table 1) overplotted on the Light Pollution Map NITESat (Falchi et al. 2016): (1) Black Bird II Observatory, (2) Rancho del Sol Observatory, (3) Mount Lemmon Sky Center, (4) Rancho Hidalgo Observatory, (5) CHART32, (6) ROSA Observatory, and (7) MJ Observatory. |
List of observatories and equipment.
Since its 2008 inception, the STSS has produced deep wide-field images of nearby Milky Way-analog galaxies in the Local Volume, revealing an assortment of large-scale tidal structures in the halos of select nearby galaxies consistent with those predicted by cosmological models (e.g., see Fig. 2 in Martínez-Delgado et al. 2010). These include giant great circles, which are either intact or fragmented (NGC 4631/M104; Martínez-Delgado et al. 2015, 2021); giant umbrellas (NGC 922; Martínez-Delgado et al. 2023b); shells (Cooper et al. 2011); thin “dog leg” streams (NGC 1097; Amorisco et al. 2015); and loops and arcs (Chonis et al. 2011). Further, STSS has detected star formation caused by a minor merger (NGC 5387; Beaton et al. 2014) and within a stream (NGC 7241; Martínez-Delgado et al. 2024). STSS has also characterized low-mass galaxies, detecting the first stellar stream around a dwarf (NGC 4449; Martínez-Delgado et al. 2012) and the tidal disruption of a dwarf spheroidal by its host beyond the Local Group for the first time (NGC 253-dw2; Romanowsky et al. 2016). Additionally, STSS has discovered new LSB dwarf satellites through a sister project, Dwarf Galaxy Survey with Amateur Telescopes (DGSAT; Javanmardi et al. 2016; Henkel et al. 2017). The use of amateur telescopes to image LSB features was further explored by other groups, such as the Dragonfly project (Abraham & van Dokkum 2014; van Dokkum et al. 2014; Merritt et al. 2016) an array of 2 × 24 Canon telephoto camera lenses, and the HERON survey (Rich et al. 2019).
In this paper, we present a compilation of the most remarkable results from the first decade of STSS. In Section 2, we describe our observational strategy and introduce the other data sets we leveraged our analysis. In Section 3, we discuss our photometry procedure. Finally, in Section 4 we present our results, and in Section 5 we discuss the future of amateur astrophotography and our conclusions.
2. Observations and data reduction
2.1. Stellar Tidal Stream Survey
The observations of STSS were conducted with seven privately owned observatories (located in Europe, the United States, and Chile) equipped with modest-sized telescopes (0.1–0.8 meters) utilizing the latest-generation commercial astronomical CCD camera. Each observing location features spectacularly dark, clear skies with seeing below 1.5″. The survey strategy strives for multiple deep exposures of each target using high-throughput clear filters with near-IR cutoff, known as luminance (L) filters (4000 Å < λ < 7000 Å) and typical exposure times of 7–8 hours. Our typical 3-σ SB detection limit (measured in random apertures of 2″ diameter) is ∼28 and 27.5 mag/arcsec2 in g- and r-bands, respectively, which is approximately two magnitudes deeper than the Sloan Digital Sky Survey (SDSS; York et al. 2000) DR8 images. In Appendix A we provide recommendations for obtaining good images with amateur telescopes.
The initial goal of this survey was to estimate the frequency of stellar streams around nearby (< 80 Mpc) spiral galaxies. We began by selecting galaxies that are visually similar to the Milky Way, with the long-term objective of comparing our findings to cosmological models of Milky Way-like galaxy formation. However, over time, we accumulated data on many spiral galaxies in which no streams were detected. This outcome is partly due to the low expected frequency of detectable streams at the surface brightness limits of our observations (estimated at 10–15%; see Miro-Carretero et al. 2025).
With the advent of the Stellar Stream Legacy Survey (see Martínez-Delgado et al. 2023a for details), we finalized our target list by selecting galaxies that showed preliminary evidence of streams in shallower imaging data (e.g., SDSS). The final sample of galaxies analyzed in this study is presented in Table 2.
List of targets.
2.2. Neutral hydrogen data
To check for a link between NGC 925 and the LSB overdensity observed within its image, we use the first data release (DR1) of the Hydrogen Accretion in LOcal GAlaxieS (HALOGAS) Survey (Heald et al. 2011) to trace the distribution of neutral hydrogen (H I) between the two objects. The data were observed using the Westerbork Synthesis Radio Telescope (WSRT) in its Maxishort configuration to optimize the imaging performance for extended targets. The correlation backend was set up to provide two linear polarizations in 1024 channels with a 10 MHz bandwidth centered at the systemic velocity of NGC 925 (−16 km s−1). Offline Hanning smoothing was used to lead to a final velocity resolution of about 4 km s−1. To recover most of the diffuse gas, we used the low-resolution data sets. The low-resolution data were imaged with a robust parameter of zero within the miriad’s “invert” task (Sault et al. 1995) and a Gaussian u, v taper corresponding to 30″ in the image plane, resulting in a synthesized beam of 37 9 × 33
 2 with position angle of approximately 0
 6 and a 1-σ noise level of 0.17 Jy beam−1 in a single channel. We refer to Heald et al. (2011) for detailed information on the observations.
2.3. DESI Legacy Imaging Survey
For comparison purposes and for the photometry analysis of NGC 150-UDG1 (see Section 4), we also used image cutouts from the public deep imaging data released recently by the DESI Legacy Imaging Survey (DESI LS; Dey et al. 2019) in three optical bands (g, r, and z), as described in Martínez-Delgado et al. (2023a). For this paper, we used data from the Dark Energy survey (DES; Dark Energy Survey Collaboration 2016), which covers 5000 deg2 of the southern sky using the Dark Energy Cam–3 deg2 field of view (FOV; Flaugher et al. 2015)–installed on the Blanco 4-m telescope at the Cerro Tololo Interamerican Observatory in Chile. The average SB limit of these images in the r-band is 28.65 mag/arcsec2 (see Section 2.3 of Miró-Carretero et al. 2024).
3. Photometry
In this section, we describe the technique to calibrate the STSS luminance images to r-band magnitudes of the Panoramic Survey Telescope and Rapid Response System survey (Pan-STARRS; Chambers et al. 2016) or SkyMapper survey (Wolf et al. 2018; Onken et al. 2019) and the process of estimating the SB limits of each field as well as other photometric measurements. We selected the r-band given it has the most wavelength overlap with our images and based on our former successful experience with previous STSS publications (see, e.g., Martínez-Delgado et al. 2015)1. First of all, World Coordinate System calibration was performed using astrometry.net.2 As the typical FOV spans several arcminutes, there were always enough stars in the field to find an accurate World Coordinate System calibration with sub-arcsecond accuracy.
3.1. Photometric calibration
We calibrated the deep luminance-filter images to the Pan-STARRS survey since most of our targets were also covered by Pan-STARRS. Where data was unavailable (ESO 545-5, NGC 150, and NGC 1511), we used catalog data from the SkyMapper Southern Sky Survey (Wolf et al. 2018; Onken et al. 2019). Pan-STARRS generally follows the SDSS filter design; the Pan-STARRS rP1- and iP1-filter are very comparable to the SDSS r- and i-filter (Tonry et al. 2012; Chambers et al. 2016; see Doi et al. 2010 for a description of the SDSS r-band). The SkyMapper survey also presents an r-filter equivalent. In Table 3, we list the relevant characteristics for the r-filter equivalent across all three surveys, demonstrating that these filters are very comparable and that our calibration therefore permits a comparison of our results to other SDSS-filter based surveys.
Filter information of wide-field surveys used for the photometric calibration in comparison to the SDSS r-filter.
We estimated the background value in each field with the SExtractor background algorithm (Bertin & Arnouts 1996) that is implemented in the photutils Python package. In this step of the analysis, we only measured bright stars in the field, and thus a single-value background estimation was sufficient. We then masked out all sources using a 3σ detection threshold where a minimum of five connected pixels must lie above the threshold. For the detected source, we incorporated a dilation size of 10 × 10 pixels. Then, we computed and subtracted the global background estimate. To minimize the influence of photometric uncertainties on the calibration process, we only detected bright sources in our calibration source catalog by applying a 10σ detection threshold. We cross-matched these sources accordingly with either the Pan-STARRS photometric catalog (DR1) or the SkyMapper catalog. We then derived an empirical zero point by comparing the offset of the catalog magnitudes and the STSS measurements, where we applied an arbitrary zero point. In Fig. 2, we show the calibration plot of NGC 3041 as an example. Here, one can observe the typical characteristics when cross-matching two surveys. The plot is divided into three sections. In the left part, one can see deviations from very bright sources. The middle section generally shows good agreement between the STSS and the catalog magnitudes. As an example, we show a zoom-in on the calibration range for NGC 150 in Fig. 3. This section is well suited to computing the zero point of our observations. The scatter in this section of the plot gives a measure of the uncertainty of our calibration process. There is a slight slope visible in the cross-matched sources, which might be caused by slight non-linear effects of the used CCDs. Nevertheless, the slope is much smaller compared to the overall scatter of the population, and therefore, the r-filter can still be used as an anchor point for our observations. For all fields, we define the middle region as lying between mmax = 14 mag and mmin = 18 mag in the calibration catalog. In the right section of the plot (m > 18, Fig. 2), deviations rise again as the catalog reaches its detection limit.
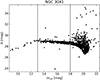 |
Fig. 2. Calibration plot of NGC 3041. We show the difference of cross-matched STSS magnitudes and calibration magnitudes from the calibration catalog. The sources that lie outside of the dashed line were excluded from the calibration. |
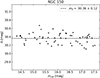 |
Fig. 3. Zero point calibration for NGC 150. Shown is a zoom-in on the magnitude range used for the calibration process. |
3.2. Detection limits
With the STSS images properly calibrated, we could then derive our detection limits (also known as the upper limit SB; see definition in Miró-Carretero et al. 2024) for each field. To do this, we used the NoiseChisel (Akhlaghi & Ichikawa 2015; Akhlaghi 2019) task of the GNU Astronomy Utilities.3 To separate the background regions from sources, we used a tesselation box size of 30 × 30 pixels and a narrow convolutional kernel with a full width half maximum of two pixels. We report the results of the upper-limit SB measurements at 3σ for circular apertures with a size of 100 arcsec2. In Table 4, we present the calibrated zero points, detection limits, and SB measurements of detected streams for all STSS galaxies. We note that some of the galaxies (NGC 150, ESO 545-5, NGC 1511, NGC 2775) show a strong variation in the sky standard deviation, which might point to problems in the flat fielding approach. For these galaxies, we report two SB limits (complete field and cropped field to an area of low-background deviation). We conclude that we can reliably trace LSB structures in all analyzed data sets.
Detection limits for STSS galaxies derived with NoiseChisel.
3.3. Comparison with other surveys
To better assess the photometric quality of our data set, we compared it with other deep surveys in Fig. 4. In this figure, we compare the fields analyzed in this study (STSS) with DES data (Miro-Carretero et al. 2025) as well as single SDSS r′-band exposures and the SDSS stack from the IAC Stripe 82 Legacy Project (Fliri & Trujillo 2016). We also include data from the Dragonfly Edge-on galaxies survey (Gilhuly et al. 2022) and the LBT Imaging of Galactic Halos and Tidal Structures (LIGHTS) survey (Trujillo et al. 2021; Zaritsky et al. 2024). Gilhuly et al. (2022) report SB limits on a scale of one arcmin2, which makes a comparison with other data sets more difficult. We therefore reevaluated the Dragonfly Edge-on galaxies survey data set with NoiseChisel4 to apply the same metric as used for the STSS data and display the adapted SB limits in Fig. 4. The distribution of the detection limits indicates that data sets obtained with amateur telescopes already enhance the ability to detect LSB structures compared to large-area surveys such as SDSS. The deepest images even reach a similar depth as those from DES, highlighting the capabilities of amateur telescopes when proper calibration techniques and observation strategies are used.
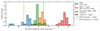 |
Fig. 4. Surface brightness limits for different surveys computed in areas equivalent to 10 × 10 arcsec2 boxes. The surveys are this work (STSS), the Stellar Stream Legacy Survey results for the DES footprint (Miró-Carretero et al. 2024), the Dragonfly survey (Gilhuly et al. 2022), the LIGHTS survey r-band (Trujillo et al. 2021; Zaritsky et al. 2024), Stripe 82, and SDSS r-band (both taken from Fliri & Trujillo 2016). |
Figure 5 shows that the results from STSS are in excellent agreement with the deep images and stellar density maps obtained with professional telescopes. Here, we highlight that professional surveys tend to suffer from widely known problems of over-subtraction around objects of a large apparent size (i.e., galaxies) during the reduction process. These problems are related to the flux adjustment in the outer parts of these structures in the sky subtraction procedure, thus eliminating the LSB information contained in the outer parts of galaxies. This problem is particularly important when the extent of a galaxy is either of the order of the size of an individual CCD in the instrumentation or when it exceeds the typical grid size in the sky subtraction procedures. As a result, the LSB signal around bright galaxies is partly subtracted by default in wide-area surveys. We show some examples of this problem in Fig. 6 for the case of DESI data. As for the Hyper Suprime-Cam Subaru Strategic Program (HSC-SSP), the sky over-subtraction was found and fixed in HSC-SSP DR2 (see Figure 5 of Aihara et al. 2019) but intentionally re-introduced in DR3 (see Figure 8 of Aihara et al. 2022). This was because of the detection and segmentation algorithms they used, which would loose significant completeness when objects become too connected. LSB-friendly detection and segmentation methods (such as those of Akhlaghi 2019) are immune to this problem.
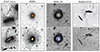 |
Fig. 5. Comparison of deep amateur images from the STSS with data obtained with large professional telescopes (top) and large-scale CCD imaging surveys (bottom). From left to right, the (top panels) show NGC 4216 taken with the Canada-French-Hawaii 3.6-m telescope (Paudel et al. 2013), NGC 2275 from stacked images from SDSS (see Morales et al. 2018), NGC 3631 with the CTIO Blanco 4-m telescope (Martínez-Delgado et al. 2023a), and a stellar density map from the resolved red giant branch stars of the stellar halo of NGC 4631 taken with the Subaru 8.2-m telescope (Tanaka et al. 2017). From left to right, the (bottom panels) show NGC 4216 taken with the BBO 0.5-m telescope (Martínez-Delgado et al. 2010), NGC 2275 (this work; see Table 2), NGC 3631 (this work; see Table 2), and NGC 4631 obtained with the ROSA 0.3-m telescope Martínez-Delgado et al. 2015). |
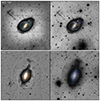 |
Fig. 6. Comparison of DESI LS image cutouts computed with the legacypipe following the approach described in Martínez-Delgado et al. 2023a for NGC 1097 and NGC 3521 (left panel) versus deep amateur images obtained with a ASA600 RC 0.60-m f/f4.5 telescope (right panel). The 3-σ SB limiting magnitudes of these images are 27.87 and 28.07 mag/arcsec2 for NGC 1097 and NGC 3521, respectively. The total FOV of both images is 30′ × 30′. This comparison illustrates the advantages of our single-chip approach used in small telescopes for wide-field cameras versus large telescope data affected by the mosaicking problems described in Sect. 3.3. |
While there are ongoing efforts to address the possible systematic effects of sky subtraction for galaxies or sources of large spatial extent for the Vera Rubin Observatory (Watkins et al. 2024) – and there are custom pipelines for Euclid that manage to preserve all LSB information even for very large objects (Cuillandre et al. 2025; Hunt et al. 2025) – these over-subtraction effects will be present in the default data releases due to the problems described above in their detection and segmentation algorithms. The development and execution of a custom reduction pipeline (on such large data sets) would be very time-consuming and require significant resources.
Due to the large FOV of monolithic cameras belonging to amateur telescopes, this over-subtraction effect is easier to deal with than in surveys such as DESI, Euclid, or LSST. Therefore, deep imaging from low-cost amateur telescopes provides an alternative way to stream discoveries in the local Universe while data processing techniques are improved sufficiently to deal with sky subtractions at all spatial scales.
3.4. Galactic cirrus contamination
The presence of Galactic cirrus is probably one of the most challenging issues in LSB research. While observations close to the Galactic disk have traditionally avoided high SB cirrus, for LSB observations, the presence of cirrus at high Galactic latitudes is frequent (e.g., Cortese et al. 2010; Sollima et al. 2010; Besla et al. 2016; Duc et al. 2018). The impact of the cirrus from the observational point of view is manifold. In Figure 7 we present an example of cirri surrounding NGC 918, NGC 2634, and M63 (all of which are not studied in this work), and it highlights that cirrus can easily be confused with extragalactic features. Moreover, regions with considerable cirrus are susceptible to problems in sky background subtraction. This is because cirrus may fill a significant region of the study field (if not all), thus leaving few regions with no presence of sources for proper modeling and sky background subtraction. Currently, there are some proposed solutions to this problem, including using the IR Astronomical Satellite (IRAS; Neugebauer et al. 1984) mission or the Planck Space Observatory (Planck Collaboration I 2020) data as priors to model the cirrus and sky background emission simultaneously (Liu et al. 2023), thus minimizing the impact on the data processing. However, this method is only effective in regions of high contamination by cirrus and on spatial scales similar to the resolution of the IRAS and Planck maps, which are on the order of 5 arcmin of full width half maximum (Lamarre et al. 2003; Miville-Deschênes & Lagache 2005). The other major problem is related to the confusion between cirrus and LSB structures or features. To resolve this confusion, there are some approaches that have recently been followed. First, the modeling and subtraction of the cirrus emission using deep and high-resolution ESA Herschel Space Observatory (Pilbratt et al. 2010) data is possible (see Mihos et al. 2017). However, this is not possible for the vast majority of fields due to the poor sky coverage of Herschel, and due to they often lack the necessary depth. Another approach is the use of optical colors to distinguish between extragalactic features and cirrus, according to the g-, r-, and i-band color characterization by Román et al. (2020). However, this requires the presence of at least two colors, in particular g-r and r-i, and it is unfeasible for single-band photometric observations, which is typically the case for the type of observations presented here.
 |
Fig. 7. Left panels: Examples of complex and filamentary Galactic cirri surrounding NGC 918 (panel A) and NGC 2634 (panel B) revealed in deep images obtained with Planewave RC 0.6-m f/6.5 and Planewave 0.42-m f/6.8 telescopes, respectively. NGC 2634 also shows shell-like tidal features with similar shapes and widths that are almost indistinguishable from the Galactic dust features. The FOV of these images are 20′ × 20′ and 30′ × 30′, respectively. Right panel: Deep image of the tidal stream around Messier 63 obtained with the Takahashi FSQ106EDX f/5 telescope. A wide-field SFD dust map of this sky region (Schlegel et al. 1998; Schlafly & Finkbeiner 2011) is shown in the bottom-right inset panel, with the corresponding FOV marked with a square. Comparison of our luminance filter image with this Galactic dust map shows that the low-surface brightness overdensity (marked as OV) situated at 35′ NW of the galaxy is the brightest part of a cirrus filament, appearing as an isolated round over-density due to the surface brightness cutoff of our luminance image. |
In the absence of Herschel far-IR counterparts and multiple photometric bands, there are still possibilities to distinguish cirrus regions from genuine extragalactic features. The low-resolution IRAS and Planck maps are often useful to warn about the presence of cirrus clouds that are of a large extent and relatively high density. For more filamentary features, visual identification is often a good resource. For example, clear connections of features to the central galaxy are highly likely to be streams. However, this classification is subjective, so there are no objective or analytical methods of discerning between cirrus and streams. For the case of dwarf galaxies, there are analytical approaches based on morphology that can be conclusive (Liu et al. 2025).
4. Results
In this section, we analyze the deep images obtained on the galactic systems studied by STSS (presented across Figures 8 to 12). For each galaxy, we focus our analysis on the presence of LSB structures and/or tidal perturbations in the galactic disk.
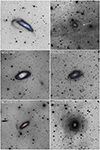 |
Fig. 8. Our STSS images of ESO 545-5, NGC 95, NGC 150, NGC 925, NGC 1511, and NGC 2775. North is up and east is left. See text for discussion on all six images. |
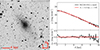 |
Fig. 9. Left panel: Galaxy NGC150-UDG1 in the r-band. Right panel: Light profile (black line) and the best-fit Sérsic profile (red curve) for the galaxy. The corresponding Sérsic parameters of the best-fit function are presented in the top-right of the diagram. |
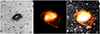 |
Fig. 10. Comparison of our NGC 925 image (panel A) against a H I map taken from the HALOGAS survey (panel B). The low-resolution data sets (with a synthesized beam of 37 |


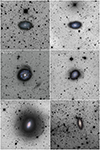 |
Fig. 11. Our STSS images of NGC 3041, NGC 3614, NGC3631, NGC 3631, NGC 4390, NGC 4414, and NGC 4684. See text for discussion on all six images. |
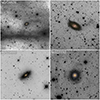 |
Fig. 12. Our STSS images of NGC 4826, NGC 5750, NGC 5866, and NGC 7742. See text for discussion on all four images. |
4.1. ESO 545-5
Our image of ESO 545-5 (Figure 8, top left) exhibits a highly perturbed edge-on disk with a clearly discernible stream extending outward from the northeast (NE) of the galaxy and looping around the southeast (SE). While difficult to see, it is plausible that the stream ends in the southwest (SW). From the image itself, it is difficult to infer the overall morphology of the stream, although the observed fragment could be consistent with a brighter loop of a rosette-like structure from a dwarf galaxy under disruption with a significant stellar mass (for example, > 109 M⊙). Indeed, a significant overdensity is observable in the loop, which could be the progenitor itself. Given that we have used a luminance filter in this work to maximize photon detection, we do not have the color information needed to constrain the stellar population of the streams we observed. Kinematic data are needed to better constrain the stream’s morphology and properties, and thus the formation and perturbations suffered by this system. So far, the LSB outskirts of ESO 545-5 have not been studied in detail.
4.2. NGC 95
NGC 95 (Figure 8, top right) appears as a peculiar barred spiral with a broken inner ring. Although the field is significantly contaminated by Galactic cirrus, our image shows a long, loop-like tidal structure that seems to extend out of our FOV, potentially formed by the infall of a dwarf satellite galaxy. Toward the west of the galaxy, the stream appears to show a discontinuity; interestingly, the propagation of the stream through the discontinuity does not seem to connect both fragments (see arrow in the panel). It is therefore difficult to assert if the full feature has a common origin from a single satellite or if there are two different pieces of streams overlapping on the sky projection. In the case of the former, it is not well understood how an interaction between the host galaxy and an infalling satellite could induce an abrupt change of direction of the satellite. While an additional gravity source could have created a gap in the stream (see e.g., Erkal & Belokurov 2015), additional, deeper data are required to further image the properties of this discontinuity. (See Martínez-Delgado et al. 2023a for a follow-up SSLS image of NGC 95, which also shows this stream discontinuity.)
4.3. NGC 150
Our deep images of NGC 150 (Figure 8, middle left), previously unreported in literature, reveal a large, asymmetric LSB overdensity to the west of the galaxy. If the overdensity is at the same distance as NGC 150, then its size and SB (given in Table 5) agree with those expected for an ultra diffuse galaxy (UDG). To further examine this LSB galaxy candidate, we analyzed its light profile and obtained its Sérsic parameters (shown in Fig. 9) using the DES data release 2 data in the g- and r-bands. After an initial background subtraction of the tiles, we cut out a region of 1200 × 1200 pixels centered on the galaxy in both bands, corresponding to the physical size of ∼30 × 30 kpc at the distance of the galaxy (on the assumption it is associated with NGC 150 at 20.9 Mpc). We used the cropped frames as the main science frame for the analysis using GALFIT (Peng et al. 2002) while additionally preparing a sigma frame, a bad pixel map (mask), and a point-spread function for the input. Figure 9 shows the object in the r-band (left) and the galaxy light profile and the best-fit model (right). The final Sérsic parameters are presented in Table 5.
Structural parameters of NGC150-UDG1.
Given the effective radius and SB of this object, at 20.9 Mpc (3.90 kpc and 26.64 mag/arcsec2 in g-band), the galaxy satisfies the UDG criteria (van Dokkum et al. 2015). The large effective radius of the galaxy puts it among the most diffuse UDGs known. The elongation of this UDG candidate (hereafter NGC150-UDG1) toward NGC 150 suggests an ongoing tidal interaction that could be connected to the formation of this UDG. Such tidal features have been seen in several other cases in similar environments (Bennet et al. 2018; Žemaitis et al. 2023) and suggested as being responsible for the transformation of non-UDG dwarf galaxies to UDGs, particularly in higher density environments (Sales et al. 2020). This formation channel, as discussed in Carleton et al. (2021), also suggests that UDGs formed through tidal interactions would host more globular clusters (GCs) than non-UDG dwarf galaxies of a similar stellar mass. The small and point-like sources in the central regions of NGC 150-UDG1 could be GCs; however, given the quality of the data and the distance of this galaxy, an in-depth analysis of the GCs is not possible. Given the current coverage map of the Euclid mission (Euclid Collaboration: Mellier et al. 2025), the galaxy will be observed by Euclid, which allows for detailed analysis of the tidal features in the optical and near-IR (Urbano et al. 2025) as well as the GCs (Saifollahi et al. 2025) at this distance.
4.4. NGC 925
We report the first deep image of NGC 925 (Figure 8, middle right). This galaxy exhibits two prominent spiral arms in a backward S shape with no galactic bulge at the center but a faint yet well-defined bar. The SE arm extends further than its northwestern (NW) counterpart, with the tip hosting prominent stellar associations, while the NW arm appears somewhat diffuse and disturbed. The bar, which is offset from NGC 925’s center by 1 kpc (Pisano et al. 1998), contains many H II regions and resolved stars (visible due to its proximity of ∼9 Mpc), and it was previously found to host widespread star formation even in areas with a low gas density (Pisano et al. 2000). Our image confirms an extended disk with long star-forming spiral arms that reach the disk’s outskirts. One can clearly see how the main spiral arms are connected to the central stellar bar, suggesting they could have been induced by the bar’s invariant manifolds (Romero-Gómez et al. 2007). Interestingly, in the SW of the galaxy, we observed a previously unreported LSB clump. Due to its faint and thus unresolvable nature, however, we could not confirm if it is a neighboring LSB galaxy with our photometry alone. Nevertheless, in Figure 10, we trace this structure using HI velocity-integrated emission (zeroth moment) data from the HALOGAS survey and demonstrate a link between the overdensity and NGC 925 in the form of a gas bridge.
4.5. NGC 1511
The starbursting galaxy NGC 1511 (Figure 8, bottom left) is the largest member of a compact group of interacting galaxies. In spite of its edge-on orientation, Buta et al. (2007) suggested it could be a late-type spiral galaxy with a single spiral arm and a bright nucleus Querejeta et al. 2021). Our data show the star-forming disk as appearing dusty with extraplanar gas, and the SW side of the bulge is obscured by a dust band, making the central region appear indented. Our deep optical image confirms a faint arc SE of the galaxy, which we tentatively link to its interaction history with its neighboring galaxies (NGC 1511A and NGC 1511b), which is in agreement with studies of NGC 1511 in X-ray, Hα, UV, and the near-IR (e.g., Dahlem et al. 2003). While not shown in their figure, the authors commented on the presence of a tidal tail (SE to north) in their X-ray data, concluding that the galaxy is heavily disturbed on its eastern side. We confirm this result with our complementary optical image.
4.6. NGC 2775
NGC 2775 (Figure 8, bottom right) is a member of a small group of galaxies (alongside NGC 2777, NGC 2773) and part of the Virgo Supercluster. NGC 2775 exhibits a smooth elliptical-like bulge surrounded by a tightly wound, segmented spiral structure that extends around the disk, with a dust ring encircling the entire galaxy. Our deep image presents three large-scale shell structures at different radii on the NE/N side of the galaxy, for the first time. The symmetrical nature of the features suggests that a past satellite merger endured more than one apocenter on its orbit around its host, although it remains possible that the innermost ring could be an independent feature. In the SE, we observed a loop feature extending out of the galaxy, which could also be related to a different accretion event.
4.7. NGC 3041
NGC 3041 (Figure 11, top left), a relatively isolated galaxy hosting an active galactic nucleus, shows a very compact galactic core with a spiral structure that extends out of the central region. Farther out, the galaxy displays numerous spiral arms hosting prominent star-forming regions. The western arms appear more symmetrical than those on the eastern side, and one appears to jut almost straight out from the central coil. In our image, we observed a thick and diffuse loop-like stream NW of the galaxy, indicative of the apocenter of a past satellite merger event.
4.8. NGC 3614
NGC 3614 (Figure 11, top right) is a barred spiral galaxy with two main arms branching outward from an internal ring and thin spiral arms containing numerous star-forming regions. We note that the small spiral galaxy SW of NGC 3614 is a background galaxy. Our deep image identifies, for the first time, two tidal streams that are completely disconnected and probably correspond to two different accretion events. One of the streams (NE) shows the tidal disruption of its progenitor, with both the leading and the trailing tidal tails visible.
4.9. NGC 3631
NGC 3631 (Figure 11, middle left) is an isolated spiral galaxy with a small, bright nucleus; an extended stellar disk; tightly coiled spiral arms; and a symmetrical appearance overall. With the first deep image of NGC 3631, we report a diffuse LSB “arm” north of the galaxy and a significantly fainter diffuse arm-looking feature south of the galaxy. We additionally note a shell-like overdensity of debris SW of the galaxy.
4.10. NGC 4390
NGC 4390 (Figure 11, middle right), located in the Virgo Cluster, is a barred spiral galaxy with star-forming spiral arms extending all the way from the nucleus to the outskirts. Southeast of the galaxy (shown within the color image) lies a candidate satellite dwarf galaxy. Our image highlights conspicuous shells surrounding the galaxy, each located at different radii from the center. From west to east, one can faintly trace two shells, which are indicative of a past merger. (See Martínez-Delgado et al. (2023a) for a follow-up SSLS image of NGC 4390.)
4.11. NGC 4414
NGC 4414 (Figure 11, bottom left) is an unbarred isolated spiral galaxy in the Coma I Cluster showcasing blue spiral arms blooming with ongoing star formation. Our data clearly map an extended stellar halo surrounding the galaxy and a well-defined shell-like structure in the SW (additionally traced by HALOGAS; de Blok et al. 2014). Such halo structures can signal a recent minor merger with a low impact parameter (see, e.g., Martínez-Delgado et al. 2023b). To verify this scenario, we created an N-body model of NGC 4414 where it recently experienced a minor merger. We used the same properties as those adopted by the model presented in Martínez-Delgado et al. (2023b); however, we set the impact parameter equal to zero to mimic the formation of the structures observed in NGC 4414 after experiencing a minor merger. For this model, we used a mass resolution of 2.5 × 10⁴ M⊙ for both the dark matter and stellar particles and a spatial resolution (minimum AMR cell size) of 40 pc. The simulation volume is a box with 1 Mpc/side with h = 0.7. The central galaxy was simulated as a stellar exponential disk embedded in a Navarro-Frenk-White (NFW; Navarro et al. 1997) dark matter halo. The initial conditions of the collisionless components were obtained using the Jeans equation moments method as introduced by Hernquist & Weil (1993). The compact dwarf system was simulated as an extended distribution of particles, which allowed us to reproduce the observed stellar stream. The initial condition of this system is a simple stellar structure that follows a compact NFW profile5.
4.12. NGC 4684
NGC 4684 (Figure 11, bottom right) appears as a lenticular galaxy6 with a diffuse nucleus encompassed by a dust ring (which, in turn, is surrounded by a bright ring). The galaxy appears to be experiencing relatively low star-forming activity given its lack of bright star formation regions. Our images confirm a large loop-like feature in the SW, which appears to be coplanar. This feature has already been noted by Miskolczi et al. (2011) (SDSS) and Mancillas et al. (2019) (MATLAS survey; Duc 2017).
4.13. NGC 4826
NGC 4826 (Figure 12, top left, also known as M64) exhibits strong dust extinction across its central regions, which, thanks to the contrast achieved against its virtually dust-free outer disk, earned the galaxy the nicknames the “Black Eye”, “Evil Eye”, and even “Sleeping Beauty”. The galaxy’s high dust extinction in the central regions has been linked to a past merger with a massive gas-poor disk galaxy (Braun et al. 1992, 1994; Rix et al. 1995). At first glance, our deep image of NGC 4826 appears highly contaminated with galactic cirrus, and the LSB structures do not seem credible. However, in Figure 13, we compare our deep image of NGC 4826 with the stellar density map from Smercina et al. (2023). It demonstrates an abundance of stream features, and most notably, we recovered an impressive umbrella-like feature in the SE. In the NW, we observed two (potentially three) stream features that, while they could also be umbrella streams, show a morphology that is harder to classify.
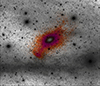 |
Fig. 13. Comparison of our deep image of NGC 4826 with the stellar density map from Smercina et al. (2023). One can clearly discern that the LSB features, which blend with galactic cirrus in the original image, are stellar debris. |
4.14. NGC 5750
NGC 5750 (Figure 12, top right) is a barred spiral galaxy with a subtle inner ring exhibiting dusty filaments branching north of the nucleus. These features are set within a blue ring of (seemingly overlapping) star-forming regions, and beyond it, the disk becomes increasingly laminar. Our image reveals a few points of interest: First, we observed a truncated overdensity NE of the disk. Northwest of the galaxy, we detected a “smoke-like” diffuse feature, which could be residue of a past accretion event. It is unclear whether these features could be caused by the same accretion event. These features have been noted in shallower detail in enhanced SDSS imaging (see Morales et al. 2018). An SB measurement of the stream from DESI LS data is available in Miró-Carretero et al. (2023).
4.15. NGC 5866
NGC 5866 (Figure 12, bottom left, also known as M102) exhibits a narrow dust lane that is often in the glare of the galaxy’s bulge and wing-like halo, hence its nickname the “Spindle Galaxy”. Beyond the dust lane, at opposite ends, the galaxy’s outer disk is defined by very sharp beams projecting outward. At first glance, the disk appears thick with no signs of recent interactions with satellites. However, as we show in Figure 14, resolving the halo reveals complex substructures, which may have been caused by old accretion event(s). We also noted an LSB feature approximately 10 arcmin from the center of the galaxy, identified as KK 236 in Karachentseva & Karachentsev (1998). It is unlikely that the feature could be linked to an old accretion event given that the distance between NGC 5866 and KK 236 is over three times the size of the halo features. Additionally, Huchtmeier et al. (2000) measured HI emission and a negative radial velocity for KK 236 (Vrad = −150 km/s), suggesting that this feature is just a local HI cloud.
 |
Fig. 14. Stellar features detected in the NGC 5866 inner halo. They include a conspicuous wedge in the NW side of the disk that suggests a recent dwarf accretion (A), coherent “spikes” (B,E, F, G), a very faint round over-density (C), and fuzzy outer plumes (D,H). The FOV is 20′ × 25′. |
The STSS images of NGC 5866 have been presented previously in Martínez-Delgado et al. 2010. Deep luminance filter images of NGC 5866’s halo have also been obtained by the HERON project (Mosenkov et al. 2020), whose author’s concluded that NGC 5866 has an “oval” or “boxy” shape with hints of filamentary structures within the halo (which we resolve in Figure 14). We note Lanzetta et al. 2024 also obtained luminance filter images of the NGC 5866 group (not the galaxy itself; see their Fig. 7). NGC 5866 has also been imaged by Martínez-Delgado et al. (2023a) (DESI LS).
4.16. NGC 7742
NGC 7742 (Figure 12, bottom right) exhibits two blue rings indicative of active star formation. Interestingly, over three decades ago, the formation of galaxies with inner H II rings was linked to past encounters where a galaxy experienced an almost direct collision with an incoming galaxy such that it penetrated the center of the other. In our images, we observed several tidal shells surrounding the galaxy. It is difficult to trace the origin of these structures without a dedicated N-body model. However, these features are compatible with a scenario where a satellite galaxy (on a circular orbit) was accreted in the past few gigayears, leaving behind a stream with a rosette-like shape (displaying different apocenters at different sides of the galaxy), which is most evident in a face-on line-of-sight view. The satellite then interacted with the central galaxy (with a small impact parameter), perturbed the disk, and triggered the formation of consecutive tidal rings within the galaxy.
In the CDM universe (where the rate of minor mergers is relatively high), a significant number of disk galaxies should show blue star-forming rings (collisional rings) over a Hubble time (see Theys & Spiegel 1977). These structures are produced by the impact of a dwarf galaxy with the disk of a central galaxy, following an almost radial orbit. The impact generates a compression and a subsequent expansion of the “stellar fluid” that propagates across the disk as a tidal ring (Lynds & Toomre 1976; Hernquist & Weil 1993). If the disk of the central galaxy is gravitationally unstable (e.g., it has a large gas fraction), it also becomes a propagating star-forming ring (blue ring; see, e.g., Cartwheel Galaxy, Higdon 1996).
The lifetime of these structures has been studied using simulations and semi-analytical models, and it has been concluded that these star-forming rings only last for ∼0.2–0.5 Gyr (Wong et al. 2006; Pellerin et al. 2010; Renaud et al. 2018; Elagali et al. 2018). After this period, they become only marginally observable up to 0.7 Gyr after the collision (Wu & Jiang 2015). Due to the short lifetime of these structures, the observations of the number of star-forming rings in nearby galaxies with stellar streams can provide a new tool to constrain the nature of dark matter when combined with the predictions from semi-empirical models of the frequency of expected star-forming rings in different dark matter paradigms. However, it is important to ensure that the star-forming rings produced by the rejuvenation of the central galaxy are excluded from this observed frequency (e.g., Sil’chenko et al. 2023). Future large surveys of the LSB universe, such as STSS (combined with deep UV data), will open the door to these new tests on the dark matter content in nearby galaxies. NGC 7742 has also been imaged by Morales et al. (2018) (SDSS) and Rich et al. (2019) (HERON).
4.17. NGC 2460
Finally, we present our deep imaging results for NGC 2460 (Figure 15). Classified as an active galactic nucleus (Gavazzi et al. 2011), NGC 2460 displays a bright, concentrated core and a dusty, tightly wound spiral structure extending to the nucleus. The outer disk forms two arms that appear to merge into one (see also Gutiérrez et al. 2011). Seemingly nearby galaxies include the unrelated LEDA 213434 and the interacting IC 2209, whose similar redshift distances (∼30 Mpc) suggest their interaction may have created NGC 2460’s extended tidal arms (Chugunov et al. 2024). The outer disk forms two arms that appear to merge into one (Gutiérrez et al. 2011).
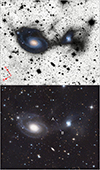 |
Fig. 15. Top panel: Luminance-filter linear-stretched image of NGC 2460 and IC 2209 and their tidal features obtained with the BBO II RCO 0.506-m f/8.1 telescope. Bottom panel: Full color image obtained with the Mount Lemmon Sky Center 0.80-m f/7 telescope. The two emission over-densities in the intersection between the tidal bridge and the NGC 2460 disk are marked with A and B. |
NGC 2460 is part of a dense group with two main interacting disk galaxies, a spheroidal dwarf, and various satellites with tidal features. In addition to a clear bridge, the smaller disk galaxy shows significant disruption, with tidal structures likely from smaller satellite destruction, including a “dog leg” (similar to that observed in the NGC 1097 stellar halo; Amorisco et al. 2015) or umbrella, and a tidal structure perpendicular to the bridge. The GALEX images reveal two star-forming clumps within this bridge (which we mark as A and B in the figure), but without kinematic data, it is difficult to conclude if they are star formation regions related to the outer arm of NGC 2460 or evidence of star formation enhancement in the bridge due to the tidal interaction between both galaxies (e.g., see Beaton et al. 2014).
A follow-up spectroscopic study of these two star formation knots in the tidal bridge’s structure is planned as a future work. NGC 2460 has also been imaged by the DESI LS in Martínez-Delgado et al. (2023a), and an SB measurement of its stream is also available in Miró-Carretero et al. (2023).
5. Conclusions and future work
The STSS has yielded an unprecedented sample of bright stellar streams in nearby spiral galaxies, including the discovery of observational analogs to the canonical morphologies found in cosmological simulations of stellar halos. Amateur astrophotography has demonstrated its robust and impressive capabilities in studying galaxy assembly in the local Universe, permitting scientific analysis of LSB galactic features with low-cost equipment.
In this paper, we have provided deep imaging of 17 nearby massive galaxies (including 16 Milky Way-like analogs) achieved with amateur telescopes. We revealed new previously unseen features related to the recent dwarf satellite accretion in their halos as well as other phenomena previously overlooked in shallower large-scale photometric surveys. Our main conclusions are as follows:
-
Modern amateur telescopes are capable of producing excellent deep wide-field imaging of nearby galaxies, with depths comparable to professional projects. Even without an optimized data acquisition strategy (such as the accurate flat field calibration or dithering pattern employed by professional telescopes), modern amateur telescopes can obtain images reaching SB limits of ∼28 mag/arcsec2 for the r-band, making them comparable to more expensive professional projects (such as DESI LS, Dragonfly; see Fig. 4), but deeper results are possible depending on the exposure time adopted and other factors. We note that the addition of a data acquisition strategy also makes it feasible to reach even deeper regimes (30–30.5 mag/arcsec2) with this low-cost equipment (Román et al. 2023).
-
Our amateur data illustrate how deep imaging of galactic outskirts can bring new insights on a wide range of aspects regarding their formation and evolution. We have discussed subjects such as (i) the (potential) star formation enhancement in galactic disks due to tidal stream interaction (e.g., NGC 2460; NGC 7742); (ii) giant, puffy satellites with tidal tails (e.g, NGC 150); (iii) an extended gas bridge linked to a stellar over-density (e.g., NGC 925); (iv) the insights provided into ISM outflows (e.g, NGC 5750); and (v) stellar stream activity.
-
Robotic amateur telescopes are excellent facilities for wide-field imaging (> 1 deg) around nearby galaxies (< 25 Mpc). Along with their very low cost, they avoid the issues associated with mosaicking smaller images to create a large wide-field image (e.g., see Fig. 6), which may occur when using data from large-scale photometry surveys, given that, among other factors, each frame has been taken under slightly different sky conditions. Due to these inconsistencies, the final image from these professional facilities suffers unintentional removal of significant faint features during the background subtraction process.
In the upcoming years, STSS will focus on identifying nearby (< 25–30 Mpc) stellar streams that, based on their properties (surface brightness, morphology, orientation), represent the most promising targets for stellar population and dynamical studies with the new generation of large telescopes and space instruments becoming available in the next decade (e.g., LSST, Roman Space Telescope, ARRAKIHS).
As for amateur astrophotography, it is transitioning from using CCDs to CMOS sensor technology. While CCD technology has produced reliable results with good sensitivity, it has been rendered obsolete by several factors: its expensive manufacturing costs in comparison to CMOS, its large pixel size (> 6 μm) becoming increasingly incompatible with the short focal length telescopes presently favored, and its inability to compete with the continuously improving specifications of the CMOS alternative. As a result, astronomical camera manufacturers have stopped producing CCD-based models. Modern CMOS sensors offer substantially reduced read and thermal noise (typically two to five times lower than CCDs); smaller sensor sizes, which greatly improve resolution with short focal lengths; and back-side illuminated designs that enhance quantum efficiency by positioning the circuit wiring behind the photosites, creating an unobstructed path for incoming photons and improving performance in low-light conditions.
While early CMOS sensors with 12-bit and 14-bit analog-to-digital converters (ADCs) raised legitimate concerns about their suitability for scientific applications due to their limited dynamic range (representing only 4096 and 16 384 gray levels respectively), the latest generation of sensors (with a 16-bit ADC) match the 65 536 gray level capability of scientific-grade CCDs. These advancements have largely addressed the linearity concerns that initially made astronomers hesitant to adopt CMOS technology for scientific work. The exceptional linearity demonstrated by modern sensors (e.g., Sony’s IMX sensors; see Alarcon et al. 2023) suggests that high-end CMOS cameras satisfy the rigorous requirements for quantitative astronomical measurements that were once the exclusive domain of CCD instruments, simultaneously offering superior noise characteristics, higher quantum efficiency, and a significantly lower cost. In this context, future releases of STSS will utilize CMOS-based telescopes and explore their suitability for LSB imaging of galaxies.
Data availability
The stacked images are available at the CDS via https://cdsarc.cds.unistra.fr/viz-bin/cat/J/A+A/701/A182
In Fig. 5 of Martínez-Delgado et al. (2015), we additionally found that the main contribution to the light observed from the stellar stream is from old metal-poor RGB stars, strengthening our choice of the r-band.
As the background noise increases toward the edge of the published data sets, we limited our surface brightness limit estimates to the central 2000 × 2000 pixels.
See Table 2 in Martínez-Delgado et al. (2023b) for the parameters used to generate the central galaxy and the compact dwarf in this simulation.
Although our project focused on spiral galaxies to explore whether the Milky Way’s merger history is typical, we include this lenticular galaxy due to its compelling LSB features. At the time of observation, it was part of a pool of candidates with preliminary evidence of faint structures in shallower data. Our deeper imaging presents these features in greater detail.
Acknowledgments
DMD acknowledges the grant CNS2022-136017 funding by MICIU/AEI /10.13039/501100011033 and the European Union Next Generation EU/PRTR, the financial support from the Severo Ochoa Grant CEX2021-001131-S funded by MCIN/AEI/10.13039/501100011033 and project PDI2020-114581GB-C21/ AEI / 10.13039/501100011033. DMD acknowledges the financial support provided by the Governments of Spain and Aragón through their general budgets and Fondo de Inversiones de Teruel, and the Aragonese Government through the Research Group E16_23R. DJB acknowledges funding from the German Science Foundation DFG, within the Collaborative Research Center SFB1491 “Cosmic Interacting Matters – From Source to Signal”. MAGF acknowledges financial support from the Spanish Ministry of Science and Innovation through the project PID2022-138896NB-C55. The Pan-STARRS1 Surveys (PS1) and the PS1 public science archive have been made possible through contributions by the Institute for Astronomy, the University of Hawaii, the Pan-STARRS Project Office, the Max-Planck Society and its participating institutes, the Max Planck Institute for Astronomy, Heidelberg and the Max Planck Institute for Extraterrestrial Physics, Garching, The Johns Hopkins University, Durham University, the University of Edinburgh, the Queen’s University Belfast, the Harvard-Smithsonian Center for Astrophysics, the Las Cumbres Observatory Global Telescope Network Incorporated, the National Central University of Taiwan, the Space Telescope Science Institute, the National Aeronautics and Space Administration under Grant No. NNX08AR22G issued through the Planetary Science Division of the NASA Science Mission Directorate, the National Science Foundation Grant No. AST-1238877, the University of Maryland, Eotvos Lorand University (ELTE), the Los Alamos National Laboratory, and the Gordon and Betty Moore Foundation. This work was partly done using GNU Astronomy Utilities (Gnuastro, ascl.net/1801.009) version 0.17. Work on Gnuastro has been funded by the Japanese Ministry of Education, Culture, Sports, Science, and Technology (MEXT) scholarship and its Grant-in-Aid for Scientific Research (21244012, 24253003), the European Research Council (ERC) advanced grant 339659-MUSICOS, the Spanish Ministry of Economy and Competitiveness (MINECO, grant number AYA2016-76219-P and PID2021-124918NA-C43) and the NextGenerationEU grant through the Recovery and Resilience Facility project ICTS-MRR-2021-03-CEFCA. The national facility capability for SkyMapper has been funded through ARC LIEF grant LE130100104 from the Australian Research Council, awarded to the University of Sydney, the Australian National University, Swinburne University of Technology, the University of Queensland, the University of Western Australia, the University of Melbourne, Curtin University of Technology, Monash University and the Australian Astronomical Observatory. SkyMapper is owned and operated by The Australian National University’s Research School of Astronomy and Astrophysics. The survey data were processed and provided by the SkyMapper Team at ANU. The SkyMapper node of the All-Sky Virtual Observatory (ASVO) is hosted at the National Computational Infrastructure (NCI). Development and support of the SkyMapper node of the ASVO has been funded in part by Astronomy Australia Limited (AAL) and the Australian Government through the Commonwealth’s Education Investment Fund (EIF) and National Collaborative Research Infrastructure Strategy (NCRIS), particularly the National eResearch Collaboration Tools and Resources (NeCTAR) and the Australian National Data Service Projects (ANDS). This research has made use of the SVO Filter Profile Service (http://svo2.cab.inta-csic.es/theory/fps/) supported from the Spanish MINECO through grant AYA2017-84089.
References
- Abraham, R. G., & van Dokkum, P. G. 2014, PASP, 126, 55 [Google Scholar]
- Aihara, H., AlSayyad, Y., Ando, M., et al. 2019, PASJ, 71, 114 [Google Scholar]
- Aihara, H., AlSayyad, Y., Ando, M., et al. 2022, PASJ, 74, 247 [NASA ADS] [CrossRef] [Google Scholar]
- Akhlaghi, M. 2019, arXiv e-prints [arXiv:1909.11230] [Google Scholar]
- Akhlaghi, M. 2023, Res. Notes Am. Astron. Soc., 7, 211 [Google Scholar]
- Akhlaghi, M., & Ichikawa, T. 2015, ApJS, 220, 1 [Google Scholar]
- Alarcon, M. R., Licandro, J., Serra-Ricart, M., et al. 2023, PASP, 135, 055001 [NASA ADS] [CrossRef] [Google Scholar]
- Amorisco, N. C., Martinez-Delgado, D., & Schedler, J. 2015, arXiv e-prints [arXiv:1504.03697] [Google Scholar]
- Beaton, R. L., Martínez-Delgado, D., Majewski, S. R., et al. 2014, ApJ, 790, 117 [CrossRef] [Google Scholar]
- Bennet, P., Sand, D. J., Zaritsky, D., et al. 2018, ApJ, 866, L11 [NASA ADS] [CrossRef] [Google Scholar]
- Bertin, E., & Arnouts, S. 1996, A&AS, 117, 393 [NASA ADS] [CrossRef] [EDP Sciences] [Google Scholar]
- Besla, G., Martínez-Delgado, D., van der Marel, R. P., et al. 2016, ApJ, 825, 20 [Google Scholar]
- Braun, R., Walterbos, R. A. M., & Kennicutt, R. C., Jr 1992, Nature, 360, 442 [Google Scholar]
- Braun, R., Walterbos, R. A. M., Kennicutt, R. C., Jr, & Tacconi, L. J. 1994, ApJ, 420, 558 [Google Scholar]
- Bullock, J. S., & Johnston, K. V. 2005, ApJ, 635, 931 [Google Scholar]
- Buta, R. J., Corwin, H. G., & Odewahn, S. C. 2007, The de Vaucouleurs Atlas of Galaxies (Cambridge, UK: Cambridge University Press) [Google Scholar]
- Carleton, T., Guo, Y., Munshi, F., Tremmel, M., & Wright, A. 2021, MNRAS, 502, 398 [NASA ADS] [CrossRef] [Google Scholar]
- Chambers, K. C., Magnier, E. A., Metcalfe, N., et al. 2016, arXiv e-prints [arXiv:1612.05560] [Google Scholar]
- Chonis, T. S., Martínez-Delgado, D., Gabany, R. J., et al. 2011, AJ, 142, 166 [NASA ADS] [CrossRef] [Google Scholar]
- Chugunov, I. V., Marchuk, A. A., Mosenkov, A. V., et al. 2024, MNRAS, 527, 9605 [Google Scholar]
- Cooper, A. P., Cole, S., Frenk, C. S., et al. 2010, MNRAS, 406, 744 [Google Scholar]
- Cooper, A. P., Martínez-Delgado, D., Helly, J., et al. 2011, ApJ, 743, L21 [NASA ADS] [CrossRef] [Google Scholar]
- Cooper, A. P., D’Souza, R., Kauffmann, G., et al. 2013, MNRAS, 434, 3348 [Google Scholar]
- Cortese, L., Bendo, G. J., Isaak, K. G., Davies, J. I., & Kent, B. R. 2010, MNRAS, 403, L26 [Google Scholar]
- Cuillandre, J. C., Bertin, E., Bolzonella, M., et al. 2025, A&A, 697, A6 [Google Scholar]
- Dahlem, M., Ehle, M., Jansen, F., et al. 2003, A&A, 403, 547 [NASA ADS] [CrossRef] [EDP Sciences] [Google Scholar]
- Dark Energy Survey Collaboration (Abbott, T., et al.) 2016, MNRAS, 460, 1270 [Google Scholar]
- de Blok, W. J. G., Józsa, G. I. G., Patterson, M., et al. 2014, A&A, 566, A80 [NASA ADS] [CrossRef] [EDP Sciences] [Google Scholar]
- Dey, A., Schlegel, D. J., Lang, D., et al. 2019, AJ, 157, 168 [Google Scholar]
- Doi, M., Tanaka, M., Fukugita, M., et al. 2010, AJ, 139, 1628 [NASA ADS] [CrossRef] [Google Scholar]
- Duc, P. A. 2017, in Formation and Evolution of Galaxy Outskirts, eds. A. Gil de Paz, J. H. Knapen, & J. C. Lee, IAU Symp., 321, 180 [NASA ADS] [Google Scholar]
- Duc, P.-A., Cuillandre, J.-C., & Renaud, F. 2018, MNRAS, 475, L40 [Google Scholar]
- Elagali, A., Wong, O. I., Oh, S.-H., et al. 2018, MNRAS, 476, 5681 [NASA ADS] [CrossRef] [Google Scholar]
- Erkal, D., & Belokurov, V. 2015, MNRAS, 450, 1136 [Google Scholar]
- Euclid Collaboration (Mellier, Y., et al.) 2025, A&A, 697, A1 [Google Scholar]
- Falchi, F., Cinzano, P., Duriscoe, D., et al. 2016, Sci. Adv., 2, e1600377 [CrossRef] [Google Scholar]
- Flaugher, B., Diehl, H. T., Honscheid, K., et al. 2015, AJ, 150, 150 [Google Scholar]
- Fliri, J., & Trujillo, I. 2016, MNRAS, 456, 1359 [Google Scholar]
- Forbes, D. A., Beasley, M. A., Bekki, K., Brodie, J. P., & Strader, J. 2003, Science, 301, 1217 [Google Scholar]
- Gavazzi, G., Savorgnan, G., & Fumagalli, M. 2011, A&A, 534, A31 [NASA ADS] [CrossRef] [EDP Sciences] [Google Scholar]
- Gilhuly, C., Merritt, A., Abraham, R., et al. 2022, ApJ, 932, 44 [NASA ADS] [CrossRef] [Google Scholar]
- Guo, Q., & White, S. D. M. 2008, MNRAS, 384, 2 [NASA ADS] [CrossRef] [Google Scholar]
- Gutiérrez, L., Erwin, P., Aladro, R., & Beckman, J. E. 2011, AJ, 142, 145 [CrossRef] [Google Scholar]
- Heald, G., Józsa, G., Serra, P., et al. 2011, A&A, 526, A118 [NASA ADS] [CrossRef] [EDP Sciences] [Google Scholar]
- Henkel, C., Javanmardi, B., Martínez-Delgado, D., Kroupa, P., & Teuwen, K. 2017, A&A, 603, A18 [NASA ADS] [CrossRef] [EDP Sciences] [Google Scholar]
- Hernquist, L., & Weil, M. L. 1993, MNRAS, 261, 804 [NASA ADS] [CrossRef] [Google Scholar]
- Higdon, J. L. 1996, ApJ, 467, 241 [NASA ADS] [CrossRef] [Google Scholar]
- Huchtmeier, W. K., Karachentsev, I. D., & Karachentseva, V. E. 2000, A&AS, 147, 187 [NASA ADS] [CrossRef] [EDP Sciences] [Google Scholar]
- Hunt, L. K., Annibali, F., Cuillandre, J. C., et al. 2025, A&A, 697, A9 [NASA ADS] [CrossRef] [EDP Sciences] [Google Scholar]
- Ibata, R., Lewis, G. F., Irwin, M., Totten, E., & Quinn, T. 2001, ApJ, 551, 294 [Google Scholar]
- Jackson, R. A., Kaviraj, S., Martin, G., et al. 2022, MNRAS, 511, 607 [NASA ADS] [CrossRef] [Google Scholar]
- Javanmardi, B., Martinez-Delgado, D., Kroupa, P., et al. 2016, A&A, 588, A89 [NASA ADS] [CrossRef] [EDP Sciences] [Google Scholar]
- Johnston, K. V., Sackett, P. D., & Bullock, J. S. 2001, ApJ, 557, 137 [NASA ADS] [CrossRef] [Google Scholar]
- Johnston, K. V., Bullock, J. S., Sharma, S., et al. 2008, ApJ, 689, 936 [Google Scholar]
- Karachentseva, V. E., & Karachentsev, I. D. 1998, A&AS, 127, 409 [NASA ADS] [CrossRef] [EDP Sciences] [Google Scholar]
- Kelz, A., Hammer, F., Jagourel, P., & MOSAIC Consortium, 2016, in Multi-Object Spectroscopy in the Next Decade: Big Questions, Large Surveys, and Wide Fields, eds. I. Skillen, M. Balcells, & S. Trager, ASP Conf. Ser., 507, 425 [Google Scholar]
- Lamarre, J. M., Puget, J. L., Bouchet, F., et al. 2003, New Astron. Rev., 47, 1017 [Google Scholar]
- Lanzetta, K. M., Gromoll, S., Shara, M. M., et al. 2024, MNRAS, 529, 197 [Google Scholar]
- Liu, Q., Abraham, R., Martin, P. G., et al. 2023, ApJ, 953, 7 [Google Scholar]
- Liu, Q., Abraham, R., Martin, P. G., et al. 2025, ApJ, 979, 175 [Google Scholar]
- Lynds, R., & Toomre, A. 1976, ApJ, 209, 382 [NASA ADS] [CrossRef] [Google Scholar]
- Majewski, S. R., Skrutskie, M. F., Weinberg, M. D., & Ostheimer, J. C. 2003, ApJ, 599, 1082 [NASA ADS] [CrossRef] [Google Scholar]
- Malin, D., & Hadley, B. 1997, in The Nature of Elliptical Galaxies; 2nd Stromlo Symposium, eds. M. Arnaboldi, G. S. Da Costa, & P. Saha, ASP Conf. Ser., 116, 460 [Google Scholar]
- Mancillas, B., Duc, P.-A., Combes, F., et al. 2019, A&A, 632, A122 [NASA ADS] [CrossRef] [EDP Sciences] [Google Scholar]
- Martínez-Delgado, D., Aparicio, A., Gómez-Flechoso, M. Á., & Carrera, R. 2001, ApJ, 549, L199 [CrossRef] [Google Scholar]
- Martínez-Delgado, D., Peñarrubia, J., Gabany, R. J., et al. 2008, ApJ, 689, 184 [CrossRef] [Google Scholar]
- Martínez-Delgado, D., Gabany, R. J., Crawford, K., et al. 2010, AJ, 140, 962 [Google Scholar]
- Martínez-Delgado, D., Romanowsky, A. J., Gabany, R. J., et al. 2012, ApJ, 748, L24 [CrossRef] [Google Scholar]
- Martínez-Delgado, D., D’Onghia, E., Chonis, T. S., et al. 2015, AJ, 150, 116 [CrossRef] [Google Scholar]
- Martínez-Delgado, D., Román, J., Erkal, D., et al. 2021, MNRAS, 506, 5030 [CrossRef] [Google Scholar]
- Martínez-Delgado, D., Cooper, A. P., Román, J., et al. 2023a, A&A, 671, A141 [NASA ADS] [CrossRef] [EDP Sciences] [Google Scholar]
- Martínez-Delgado, D., Roca-Fàbrega, S., Miró-Carretero, J., et al. 2023b, A&A, 669, A103 [NASA ADS] [CrossRef] [EDP Sciences] [Google Scholar]
- Martínez-Delgado, D., Roca-Fàbrega, S., Gil de Paz, A., et al. 2024, A&A, 684, A157 [NASA ADS] [CrossRef] [EDP Sciences] [Google Scholar]
- Mateo, M. 1997, in The Nature of Elliptical Galaxies; 2nd Stromlo Symposium, eds. M. Arnaboldi, G. S. Da Costa, & P. Saha, ASP Conf. Ser., 116, 259 [Google Scholar]
- Merritt, A., van Dokkum, P., Abraham, R., & Zhang, J. 2016, ApJ, 830, 62 [Google Scholar]
- Mihos, J. C., Harding, P., Feldmeier, J. J., et al. 2017, ApJ, 834, 16 [Google Scholar]
- Miró-Carretero, J., Martínez-Delgado, D., Farràs-Aloy, S., et al. 2023, A&A, 669, L13 [NASA ADS] [CrossRef] [EDP Sciences] [Google Scholar]
- Miró-Carretero, J., Martínez-Delgado, D., Gómez-Flechoso, M. A., et al. 2024, A&A, 691, A196 [NASA ADS] [CrossRef] [EDP Sciences] [Google Scholar]
- Miro-Carretero, J., Gomez-Flechoso, M. A., Martinez-Delgado, D., et al. 2025, A&A, 700, A176 [Google Scholar]
- Miskolczi, A., Bomans, D. J., & Dettmar, R. J. 2011, A&A, 536, A66 [NASA ADS] [CrossRef] [EDP Sciences] [Google Scholar]
- Miville-Deschênes, M.-A., & Lagache, G. 2005, ApJS, 157, 302 [Google Scholar]
- Morales, G., Martínez-Delgado, D., Grebel, E. K., et al. 2018, A&A, 614, A143 [NASA ADS] [CrossRef] [EDP Sciences] [Google Scholar]
- Mosenkov, A., Rich, R. M., Koch, A., et al. 2020, MNRAS, 494, 1751 [NASA ADS] [CrossRef] [Google Scholar]
- Navarro, J. F., Frenk, C. S., & White, S. D. M. 1997, ApJ, 490, 493 [Google Scholar]
- Neugebauer, G., Habing, H. J., van Duinen, R., et al. 1984, ApJ, 278, L1 [NASA ADS] [CrossRef] [Google Scholar]
- Onken, C. A., Wolf, C., Bessell, M. S., et al. 2019, PASA, 36, e033 [Google Scholar]
- Padovani, P., & Cirasuolo, M. 2023, Contemp. Phys., 64, 47 [NASA ADS] [CrossRef] [Google Scholar]
- Paudel, S., Duc, P.-A., Côté, P., et al. 2013, ApJ, 767, 133 [NASA ADS] [CrossRef] [Google Scholar]
- Pellerin, A., Meurer, G. R., Bekki, K., et al. 2010, AJ, 139, 1369 [NASA ADS] [CrossRef] [Google Scholar]
- Peng, C. Y., Ho, L. C., Impey, C. D., & Rix, H.-W. 2002, AJ, 124, 266 [Google Scholar]
- Pilbratt, G. L., Riedinger, J. R., Passvogel, T., et al. 2010, A&A, 518, L1 [NASA ADS] [CrossRef] [EDP Sciences] [Google Scholar]
- Pisano, D. J., Wilcots, E. M., & Elmegreen, B. G. 1998, AJ, 115, 975 [NASA ADS] [CrossRef] [Google Scholar]
- Pisano, D. J., Wilcots, E. M., & Elmegreen, B. G. 2000, AJ, 120, 763 [NASA ADS] [CrossRef] [Google Scholar]
- Planck Collaboration I. 2020, A&A, 641, A1 [NASA ADS] [CrossRef] [EDP Sciences] [Google Scholar]
- Pohlen, M., Balcells, M., Lütticke, R., & Dettmar, R. J. 2003, A&A, 409, 485 [NASA ADS] [CrossRef] [EDP Sciences] [Google Scholar]
- Querejeta, M., Schinnerer, E., Meidt, S., et al. 2021, A&A, 656, A133 [NASA ADS] [CrossRef] [EDP Sciences] [Google Scholar]
- Renaud, F., Athanassoula, E., Amram, P., et al. 2018, MNRAS, 473, 585 [NASA ADS] [CrossRef] [Google Scholar]
- Rich, R. M., Mosenkov, A., Lee-Saunders, H., et al. 2019, MNRAS, 490, 1539 [Google Scholar]
- Rix, H.-W. R., Kennicutt, R. C., Jr, Braun, R., & Walterbos, R. A. M. 1995, ApJ, 438, 155 [Google Scholar]
- Rodrigo, C., & Solano, E. 2020, in XIV.0 Scientific Meeting (virtual) of the Spanish Astronomical Society, 182 [Google Scholar]
- Rodrigo, C., Solano, E., & Bayo, A. 2012, SVO Filter Profile Service Version 1.0, IVOA Working Draft 15 October 2012 [Google Scholar]
- Román, J., Trujillo, I., & Montes, M. 2020, A&A, 644, A42 [NASA ADS] [CrossRef] [EDP Sciences] [Google Scholar]
- Román, J., Rich, R. M., Ahvazi, N., et al. 2023, A&A, 679, A157 [NASA ADS] [CrossRef] [EDP Sciences] [Google Scholar]
- Romanowsky, A. J., Martínez-Delgado, D., Martin, N. F., et al. 2016, MNRAS, 457, L103 [Google Scholar]
- Romero-Gómez, M., Athanassoula, E., Masdemont, J. J., & García-Gómez, C. 2007, A&A, 472, 63 [NASA ADS] [CrossRef] [EDP Sciences] [Google Scholar]
- Saifollahi, T., Voggel, K., Lançon, A., et al. 2025, A&A, 697, A10 [NASA ADS] [CrossRef] [EDP Sciences] [Google Scholar]
- Sales, L. V., Navarro, J. F., Peñafiel, L., et al. 2020, MNRAS, 494, 1848 [Google Scholar]
- Sault, R. J., Teuben, P. J., & Wright, M. C. H. 1995, in Astronomical Data Analysis Software and Systems IV, eds. R. A. Shaw, H. E. Payne, & J. J. E. Hayes, ASP Conf. Ser., 77, 433 [Google Scholar]
- Schlafly, E. F., & Finkbeiner, D. P. 2011, ApJ, 737, 103 [Google Scholar]
- Schlegel, D. J., Finkbeiner, D. P., & Davis, M. 1998, ApJ, 500, 525 [Google Scholar]
- Shang, Z., Zheng, Z., Brinks, E., et al. 1998, ApJ, 504, L23 [Google Scholar]
- Shipp, N., Panithanpaisal, N., Necib, L., et al. 2023, ApJ, 949, 44 [NASA ADS] [CrossRef] [Google Scholar]
- Sil’chenko, O., Moiseev, A., Oparin, D., Beckman, J. E., & Font, J. 2023, A&A, 669, L10 [NASA ADS] [CrossRef] [EDP Sciences] [Google Scholar]
- Smercina, A., Bell, E. F., Price, P. A., et al. 2023, ApJ, 949, L37 [Google Scholar]
- Sola, E., Duc, P. A., Urbano, M., et al. 2025, MNRAS, 541, 3015 [Google Scholar]
- Sollima, A., Gil de Paz, A., Martinez-Delgado, D., et al. 2010, A&A, 516, A83 [NASA ADS] [CrossRef] [EDP Sciences] [Google Scholar]
- Tal, T., van Dokkum, P. G., Nelan, J., & Bezanson, R. 2009, AJ, 138, 1417 [Google Scholar]
- Tanaka, M., Chiba, M., & Komiyama, Y. 2017, ApJ, 842, 127 [Google Scholar]
- Theys, J. C., & Spiegel, E. A. 1977, ApJ, 212, 616 [NASA ADS] [CrossRef] [Google Scholar]
- Tonry, J. L., Stubbs, C. W., Lykke, K. R., et al. 2012, ApJ, 750, 99 [Google Scholar]
- Trujillo, I., D’Onofrio, M., Zaritsky, D., et al. 2021, A&A, 654, A40 [NASA ADS] [CrossRef] [EDP Sciences] [Google Scholar]
- Urbano, M., Duc, P. A., Saifollahi, T., et al. 2025, A&A, 700, A104 [NASA ADS] [CrossRef] [EDP Sciences] [Google Scholar]
- van Dokkum, P. G., Abraham, R., & Merritt, A. 2014, ApJ, 782, L24 [Google Scholar]
- van Dokkum, P. G., Abraham, R., Merritt, A., et al. 2015, ApJ, 798, L45 [NASA ADS] [CrossRef] [Google Scholar]
- Walder, M., Erkal, D., Collins, M., & Martinez-Delgado, D. 2024, arXiv e-prints [arXiv:2402.13314] [Google Scholar]
- Watkins, A. E., Kaviraj, S., Collins, C. C., et al. 2024, MNRAS, 528, 4289 [NASA ADS] [CrossRef] [Google Scholar]
- Wolf, C., Onken, C. A., Luvaul, L. C., et al. 2018, PASA, 35 [Google Scholar]
- Wong, O. I., Meurer, G. R., Bekki, K., et al. 2006, MNRAS, 370, 1607 [NASA ADS] [CrossRef] [Google Scholar]
- Wu, Y.-T., & Jiang, I.-G. 2015, ApJ, 805, 32 [NASA ADS] [CrossRef] [Google Scholar]
- York, D. G., Adelman, J., Anderson, J. E., Jr, et al. 2000, AJ, 120, 1579 [Google Scholar]
- Zaritsky, D., Golini, G., Donnerstein, R., et al. 2024, AJ, 168, 69 [Google Scholar]
- Žemaitis, R., Ferguson, A. M. N., Okamoto, S., et al. 2023, MNRAS, 518, 2497 [Google Scholar]
Appendix A: Recommendation for observing extended low surface brightness structures with amateur telescopes
The surface-brightness limits we need to reach reliably for our work on ground is critically affected by numerous technical constraints. This ranges from hardware choices, observing strategies, target selection to calibration procedures and a proper understanding thereof. In the following we provide a summary of recommendations that must be taken into account for future work. Like this, we (i) lower the risk of false detections, (ii) reduce the introduction of artificial features into the background, (iii) keep the background level low, and (iv) allow for better removal of instrumental and environmental fingerprints from the data.
A.1. Hardware setup
Straylight supression is mandatory. Direct paths from artificial light sources to the telescope and instrument must be blocked. Light-emitting diodes from local electronics in the observatory dome must be taped to minimizestraylight. Heating elements should be used to prevent condensation on sky-facing optical elements that may cool down below ambient temperature. The largest possible filters and adaptor rings etc should be used, to minimize vignetting of the optical path. Any vignetting needs to be corrected afterward, and the correction by flat fields is never perfect for numerous reasons; chromaticity of the system’s spectral response, different spectral energy distribution (SED) of the flat-field source and the night sky, internal scattering are some reasons, to name a few.
A.2. Choosing suitable observing times
Strictly dark conditions are mandatory, that is the moon must be below the horizon and the sun at least 18 degrees below horizon. Using a filter that cuts off wavelengths above about 700 nm will suppress OH airglow lines, which are variable on time scales of minutes and angular scales of arcminutes.
If the sky background is increased by a factor n, then the exposure time must be at least n times as long to achieve the same signal-to-noise ratio (S/N), assuming perfectly calibrated and shot-noise-limited data. Reality is worse, because higher sky levels typically means higher systematics that can be hard to remove, degrading the achievable surface-brightness limit.
Observations in medium- to high humidity conditions must be avoided, as external optical surfaces easily cool below the dew point. Even thin layers of condensation that might not be visible by eye will considerably increase the straylight from in-field and out-of-field sources, reduce the performance of optical coatings, and cause gradients in the image background. This compromises the science data as well as flat-field calibrations. Temperature sensors at the telescope and control of ambient conditions (dew-point temperature) are important.
Observations must only be conducted in clear conditions. Thin cirrus clouds are not visible to the eye in dark conditions, and all-sky cameras must be used to judge transparency. Guide counts can also be used to evaluate transparency, but they are typically impacted by seeing. Data processing can easily detect transmission variations at the level of 1% or below, so that bad exposures can be rejected.
A.3. Target selection
The FOV must be matched to the target. The data presented in this paper show that stellar streams easily have angular extents exceeding the diameters of their host galaxies by a factor of three or more. The camera’s linear FOV should therefore be at least ten times as large as the major axis of the galaxy. Otherwise one cannot use sufficiently wide dithers while at the same time keeping the target in the less problematic, unvignetted detector areas.
Airmass is also critical, and targets must be observed as high as possible. If a target is visible at airmass 1.0, then one should not exceed an airmass of 1.3, where the sky background about 30% higher, and transparency reduced. If a target does not get higher than airmass 1.2, once could plausibly observe it down to 1.4. Targets at even lower airmass are better observed from a different geographic location.
Another reason to stick to low airmass is the wide FoV, which captures background gradients from differential airmasses. For example, the airmass at 45° elevation is 1.41. A FOV of 2° would capture airmasses of 1.38 and 1.44 in the same exposure, which could lead to a 4% variation in background signal that needs to be corrected accurately.
A.4. Observing and dithering strategy
The exposure times must be chosen such that the images are background-limited. That is the photon noise from the sky background must exceed the combined readout and dark-current noise by a factor of five at least.
The first thing to consider is the maximum expected size of your target. As the images through out this paper show, at low surface brightness levels, the maximum "size" of a galaxy (where it becomes indistinguisable from the noise and undetectable at your final deep stacked image) is much larger than their brighter regions which are visible in public sky navigators.
Having determined the exposure time and expected size of your target, it is important to decide where your target will be placed over each exposure. Commercial CCDs/detectors are not always a square but can be rectangular. If your target is not a perfect circle, be sure to exploit this fact and align the longer axis of your detector to the major axis of your target.
The most important thing in designing a good observing strategy is to place your target on very different pixels/regions of your detector. For example, if your object’s maximum length is roughly half the larger axis of your detector you can do this: in one exposure, place the edges of your target (accounting for its maximum expected extent) on the top-left quadrant of your detector. In the next exposure, place it on the bottom-right, then top-right and finally bottom-left. Finally, in the fifth exposure, your target can be in the middle of your frame. If you need more than 5 exposures (which is usually the case), you can repeat this pointing pattern, but do not point to the exact same point, allow some random dither (on the scale of a couple of pixels, but never an exact multiple of the pixel size).
The yellow regions of the last panel in Figure 1 of Akhlaghi (2023) show the deep region after stacking the exposures of the 5-point strategy above. For a more complete description of this scenario with implementation details (including how to account for strong vignetting, large areas of bad pixels, the curvature of the sky and etc), see the dedicated tutorial within Gnuastro7. A full implementation of this concept (to move your target across your field of view) in a scientific paper can be seen in Trujillo et al. (2021) (compare the exposure maps of Figure 1 with Figure 2).
As the two example exposure maps above show, the final result of stacking/coadding images with this strategy will be larger than your original detector size, but only the central part will be at full depth (as you go to the outer regions, the depth decreases sharply). Because a large fraction of the area of each exposure is not actually covered by your large and extended target, it can be used for accurate measurement of the background flux and it will also be possible to derive the flat-field pattern directly from the science images (see Trujillo et al. 2021). Therefore, the regions that are ultimately shallower in the final stack have helped in better calibrate the final output.
The 5-pointing example above assumed a ring with a radius that was a quarter of the longer axis of your detector. If your target is sufficiently smaller than the limit above, you can use multile rings with different radii. For example, you can use an inner ring with a radius of one-eigth of your detector’s longer axis. In any case, you can use the tool described in Akhlaghi (2023) to simulate the final stacked image of any pointing pattern before doing the observations to make sure they satisfy your plans.
Wide whole sky surveys that use large professional telescopes with cameras that are composed of many detectors cannot afford to tailor their observing strategy for individual galaxies like the scenario proposed here. Their science-cases are also focused more on compact sources like stars or high redshift galaxies. As a result, the algorithms they use are are not able to accurately calibrate some steps (mostly the sky, but also the flat). Therefore dedicated data taken with commercial telescopes and detectors which are accurately reduced can be used very well in the study of the low surface brightness universe.
A.5. Calibration strategy
Achieving a uniform background in a flat-fielded image is very difficult, as many factors come into play: vignetting, differential quantum efficiency, different spectrum of the flat-field light source and the night sky background, external and internal scattered light, internal reflections between filters and collimators, variable plate scale, tree rings, detector doping concentration variations, etc. A simple division by a flat-field cannot correctly account for all these effects, and is not sufficient for the detection of low-surface brightness features. The dithering strategy outlined above is crucial in this respect, as it allows the computation of suitable correction images that flatten the background (but not necessarily photometric zero point variations).
Twilight flats are preferred over dome or screen flats, maintaining the focus of the imaging setup. The flats should be either actively dithered, or the telescope tracking be turned off. The camera angle must be the same as during the night-time observations. It is sufficient to take 10–20 flats per exposure setup. Cameras with even illumination shutters are preferred; otherwise, sufficiently long integration times must be chosen for the flat fields.
At least 20 biases should be taken per night, and the bias must be stable within a night. A similar number of dark frames is recommended, and the detector temperature and exposure time must be the same as for the science exposures. Flat fields usually do not require matching dark frames, biases are sufficient.
A.6. Detector considerations
Large detectors can have multiple, configurable readout ports. A single readout port should be used, so that all pixels experience the same systematics by the electronics chain. Detector systems and cameras that do not allow full control, that adjust internal settings on the fly or even apply some level of pixel processing, should be avoided.
All Tables
Filter information of wide-field surveys used for the photometric calibration in comparison to the SDSS r-filter.
All Figures
|
Fig. 1. Top row: Three of the amateur telescopes used in STSS: AstroPhysics 0.13-m f/4.5 (left), RCO 0.506-m f/8.1 (center), and CHART32 Cassegrain 0.80-m f/7 (right). Bottom row: Location of the robotic telescope facilities used in STSS (see Table 1) overplotted on the Light Pollution Map NITESat (Falchi et al. 2016): (1) Black Bird II Observatory, (2) Rancho del Sol Observatory, (3) Mount Lemmon Sky Center, (4) Rancho Hidalgo Observatory, (5) CHART32, (6) ROSA Observatory, and (7) MJ Observatory. |
| In the text | |
|
Fig. 2. Calibration plot of NGC 3041. We show the difference of cross-matched STSS magnitudes and calibration magnitudes from the calibration catalog. The sources that lie outside of the dashed line were excluded from the calibration. |
| In the text | |
|
Fig. 3. Zero point calibration for NGC 150. Shown is a zoom-in on the magnitude range used for the calibration process. |
| In the text | |
|
Fig. 4. Surface brightness limits for different surveys computed in areas equivalent to 10 × 10 arcsec2 boxes. The surveys are this work (STSS), the Stellar Stream Legacy Survey results for the DES footprint (Miró-Carretero et al. 2024), the Dragonfly survey (Gilhuly et al. 2022), the LIGHTS survey r-band (Trujillo et al. 2021; Zaritsky et al. 2024), Stripe 82, and SDSS r-band (both taken from Fliri & Trujillo 2016). |
| In the text | |
|
Fig. 5. Comparison of deep amateur images from the STSS with data obtained with large professional telescopes (top) and large-scale CCD imaging surveys (bottom). From left to right, the (top panels) show NGC 4216 taken with the Canada-French-Hawaii 3.6-m telescope (Paudel et al. 2013), NGC 2275 from stacked images from SDSS (see Morales et al. 2018), NGC 3631 with the CTIO Blanco 4-m telescope (Martínez-Delgado et al. 2023a), and a stellar density map from the resolved red giant branch stars of the stellar halo of NGC 4631 taken with the Subaru 8.2-m telescope (Tanaka et al. 2017). From left to right, the (bottom panels) show NGC 4216 taken with the BBO 0.5-m telescope (Martínez-Delgado et al. 2010), NGC 2275 (this work; see Table 2), NGC 3631 (this work; see Table 2), and NGC 4631 obtained with the ROSA 0.3-m telescope Martínez-Delgado et al. 2015). |
| In the text | |
|
Fig. 6. Comparison of DESI LS image cutouts computed with the legacypipe following the approach described in Martínez-Delgado et al. 2023a for NGC 1097 and NGC 3521 (left panel) versus deep amateur images obtained with a ASA600 RC 0.60-m f/f4.5 telescope (right panel). The 3-σ SB limiting magnitudes of these images are 27.87 and 28.07 mag/arcsec2 for NGC 1097 and NGC 3521, respectively. The total FOV of both images is 30′ × 30′. This comparison illustrates the advantages of our single-chip approach used in small telescopes for wide-field cameras versus large telescope data affected by the mosaicking problems described in Sect. 3.3. |
| In the text | |
|
Fig. 7. Left panels: Examples of complex and filamentary Galactic cirri surrounding NGC 918 (panel A) and NGC 2634 (panel B) revealed in deep images obtained with Planewave RC 0.6-m f/6.5 and Planewave 0.42-m f/6.8 telescopes, respectively. NGC 2634 also shows shell-like tidal features with similar shapes and widths that are almost indistinguishable from the Galactic dust features. The FOV of these images are 20′ × 20′ and 30′ × 30′, respectively. Right panel: Deep image of the tidal stream around Messier 63 obtained with the Takahashi FSQ106EDX f/5 telescope. A wide-field SFD dust map of this sky region (Schlegel et al. 1998; Schlafly & Finkbeiner 2011) is shown in the bottom-right inset panel, with the corresponding FOV marked with a square. Comparison of our luminance filter image with this Galactic dust map shows that the low-surface brightness overdensity (marked as OV) situated at 35′ NW of the galaxy is the brightest part of a cirrus filament, appearing as an isolated round over-density due to the surface brightness cutoff of our luminance image. |
| In the text | |
|
Fig. 8. Our STSS images of ESO 545-5, NGC 95, NGC 150, NGC 925, NGC 1511, and NGC 2775. North is up and east is left. See text for discussion on all six images. |
| In the text | |
|
Fig. 9. Left panel: Galaxy NGC150-UDG1 in the r-band. Right panel: Light profile (black line) and the best-fit Sérsic profile (red curve) for the galaxy. The corresponding Sérsic parameters of the best-fit function are presented in the top-right of the diagram. |
| In the text | |
|
Fig. 10. Comparison of our NGC 925 image (panel A) against a H I map taken from the HALOGAS survey (panel B). The low-resolution data sets (with a synthesized beam of 37 |
| In the text | |
|
Fig. 11. Our STSS images of NGC 3041, NGC 3614, NGC3631, NGC 3631, NGC 4390, NGC 4414, and NGC 4684. See text for discussion on all six images. |
| In the text | |
|
Fig. 12. Our STSS images of NGC 4826, NGC 5750, NGC 5866, and NGC 7742. See text for discussion on all four images. |
| In the text | |
|
Fig. 13. Comparison of our deep image of NGC 4826 with the stellar density map from Smercina et al. (2023). One can clearly discern that the LSB features, which blend with galactic cirrus in the original image, are stellar debris. |
| In the text | |
|
Fig. 14. Stellar features detected in the NGC 5866 inner halo. They include a conspicuous wedge in the NW side of the disk that suggests a recent dwarf accretion (A), coherent “spikes” (B,E, F, G), a very faint round over-density (C), and fuzzy outer plumes (D,H). The FOV is 20′ × 25′. |
| In the text | |
|
Fig. 15. Top panel: Luminance-filter linear-stretched image of NGC 2460 and IC 2209 and their tidal features obtained with the BBO II RCO 0.506-m f/8.1 telescope. Bottom panel: Full color image obtained with the Mount Lemmon Sky Center 0.80-m f/7 telescope. The two emission over-densities in the intersection between the tidal bridge and the NGC 2460 disk are marked with A and B. |
| In the text | |
Current usage metrics show cumulative count of Article Views (full-text article views including HTML views, PDF and ePub downloads, according to the available data) and Abstracts Views on Vision4Press platform.
Data correspond to usage on the plateform after 2015. The current usage metrics is available 48-96 hours after online publication and is updated daily on week days.
Initial download of the metrics may take a while.