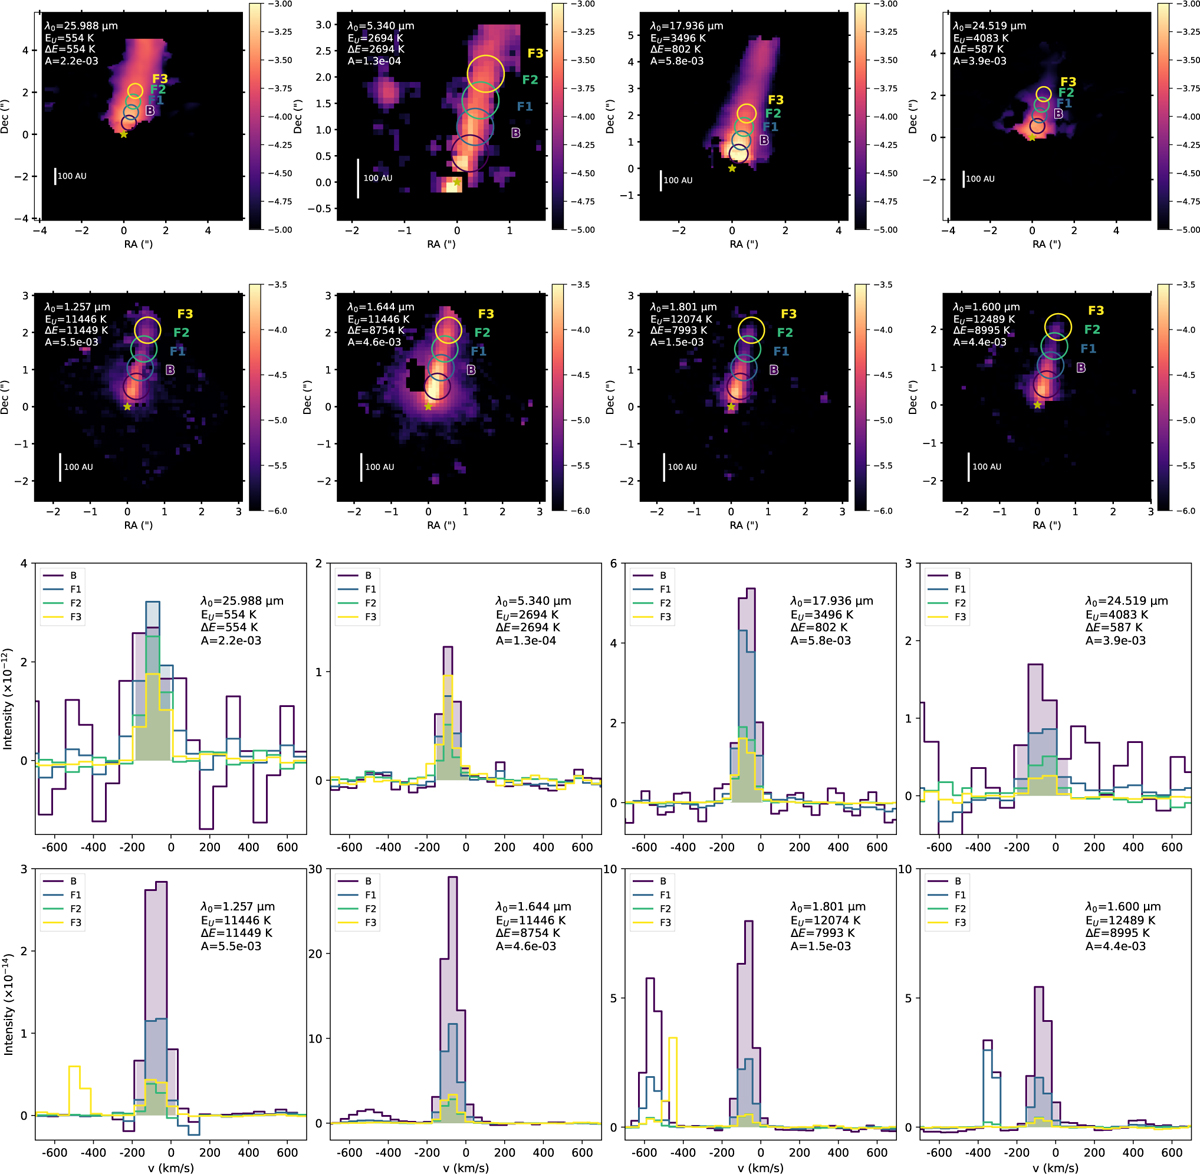
Fig. 2
Download original image
[Fe II] emission lines used in this study and detected with NIRSpec and MIRI, arranged in order of increasing upper energy (EU/k). Top panels: moment-0 maps (in units of erg s−1 cm2 sr−1), constructed by integrating the emission across the frequency range indicated by the shaded regions in the corresponding spectra below. Although integration is performed in frequency space, the x-axis is displayed in velocity (km s−1) for clarity. A 3-sigma threshold is applied. The maps are overlaid with circular, color-coded apertures (0.7″) used consistently throughout this study. Bottom panels: spectra (in units of erg s−1 cm−2 sr−1 Hz−1) extracted from each aperture, with shaded regions highlighting the velocity range used for integration, primarily focusing on blue-shifted emission. Each subplot includes the rest wavelength (λ0), transition and upper energies (∆E, EU), and Einstein-A value for reference.
Current usage metrics show cumulative count of Article Views (full-text article views including HTML views, PDF and ePub downloads, according to the available data) and Abstracts Views on Vision4Press platform.
Data correspond to usage on the plateform after 2015. The current usage metrics is available 48-96 hours after online publication and is updated daily on week days.
Initial download of the metrics may take a while.