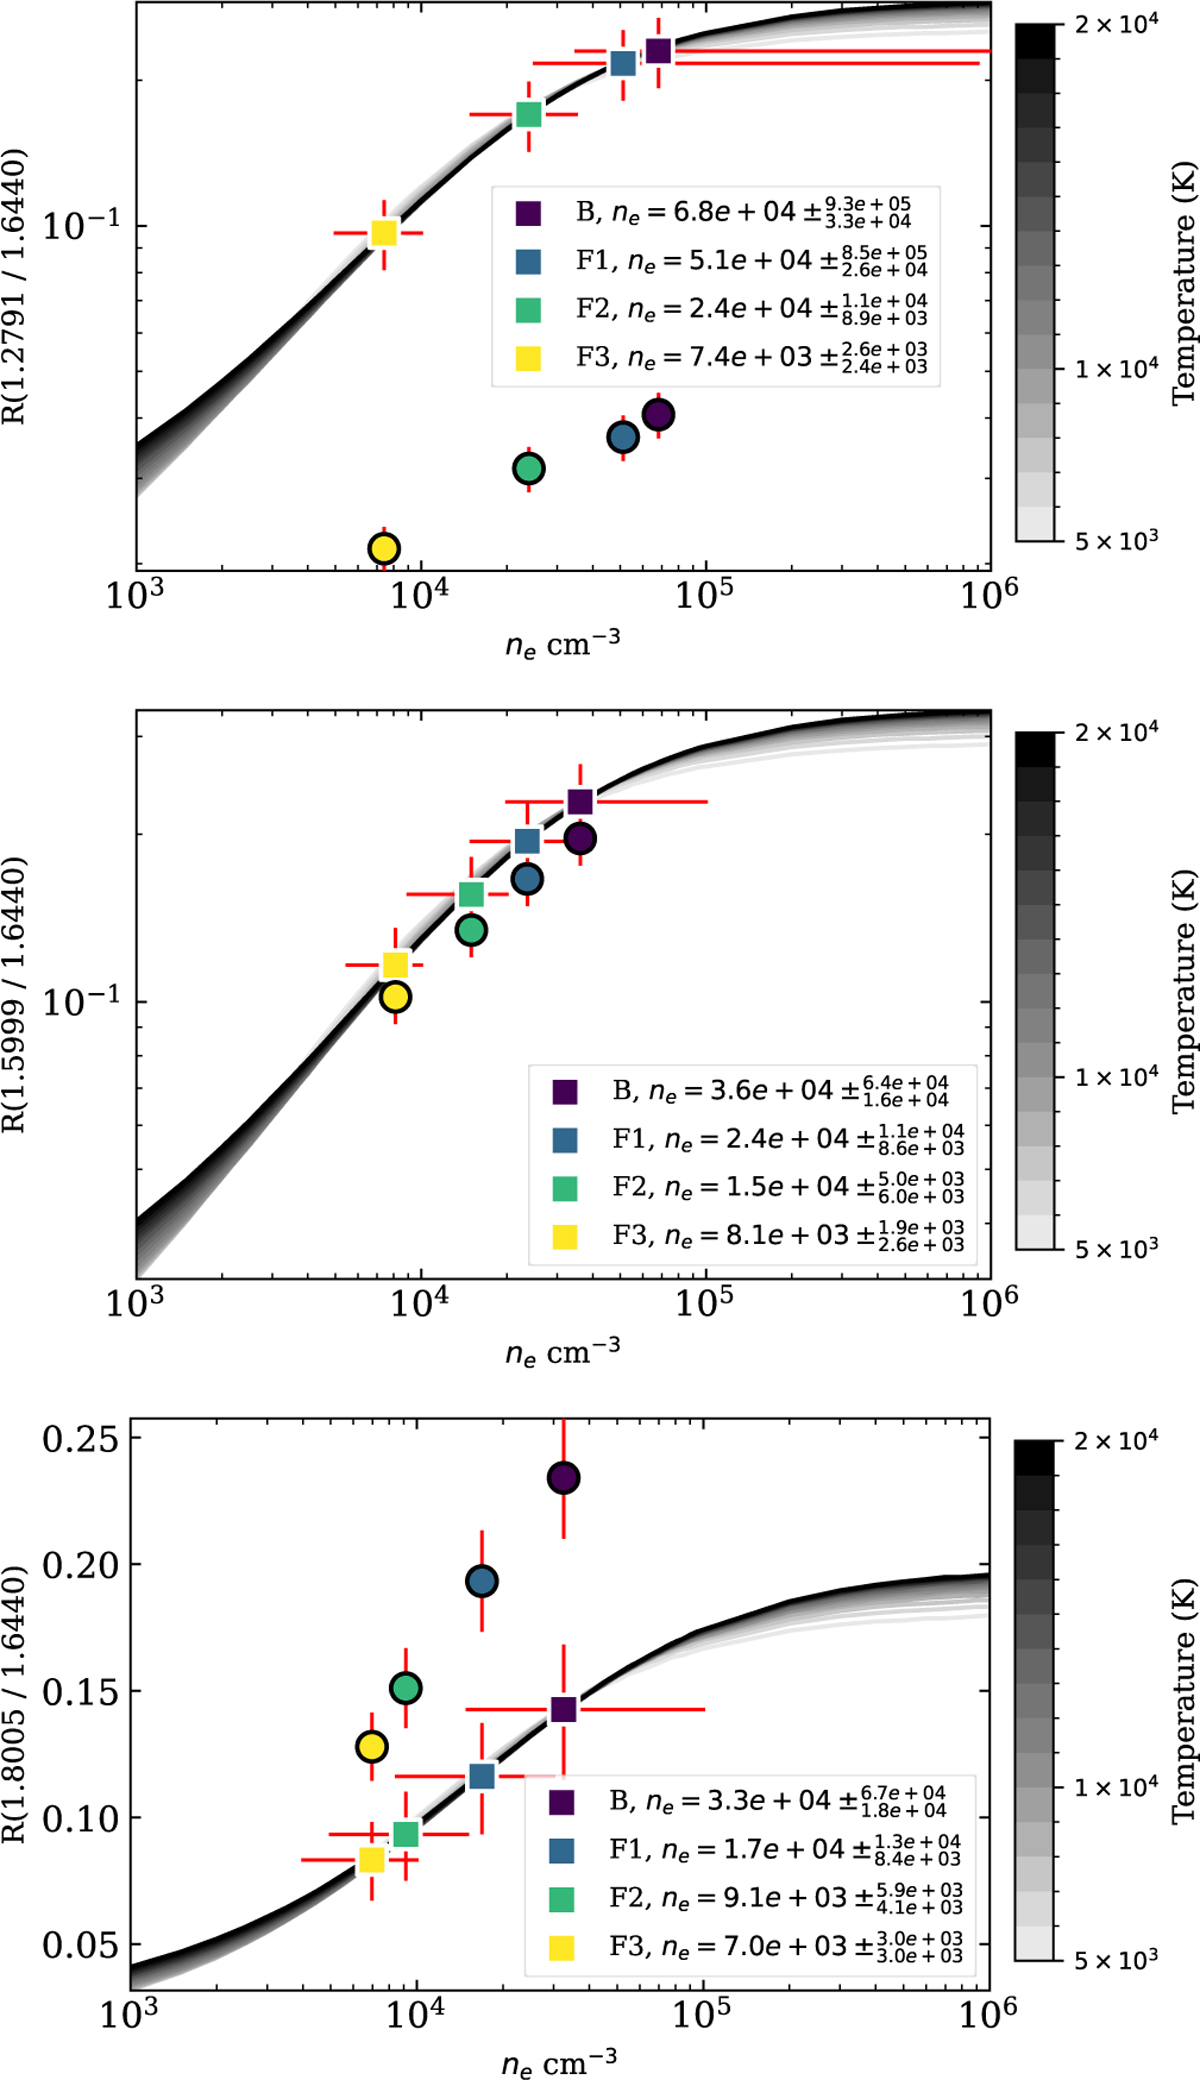
Fig. 4
Download original image
Examples of density-sensitive NIR line ratios, where the CLOUDY model predictions are shown as solid lines shaded by temperature. Observed line ratios with uncertainties are represented by circles, while extinction-corrected ratios are shown as squares color-coded by jet location (see Fig. 2). The extinction-corrected ratio, accounting for uncertainties, determines the electron density from the model, aligning with the x-axis position of both observed and corrected ratios. Top: shorter-wavelength line is more affected by extinction, leading to an increased ratio after correction. Middle: line ratio with similar rest wavelengths, minimally affected by extinction, where the observed ratio closely matches the expected electron density. Bottom: longer wavelength line that is less affected by extinction and causes the ratio to decrease after correction. Following extinction correction using established NIR curves (Section 4.1), all corrected ratios fall within the model-predicted range, showing consistent electron density trends across jet locations and line pairings. This electron density serves as a starting point for comparing relative extinction in the NIR/MIR (Section 4.3).
Current usage metrics show cumulative count of Article Views (full-text article views including HTML views, PDF and ePub downloads, according to the available data) and Abstracts Views on Vision4Press platform.
Data correspond to usage on the plateform after 2015. The current usage metrics is available 48-96 hours after online publication and is updated daily on week days.
Initial download of the metrics may take a while.