Fig. 5
Download original image
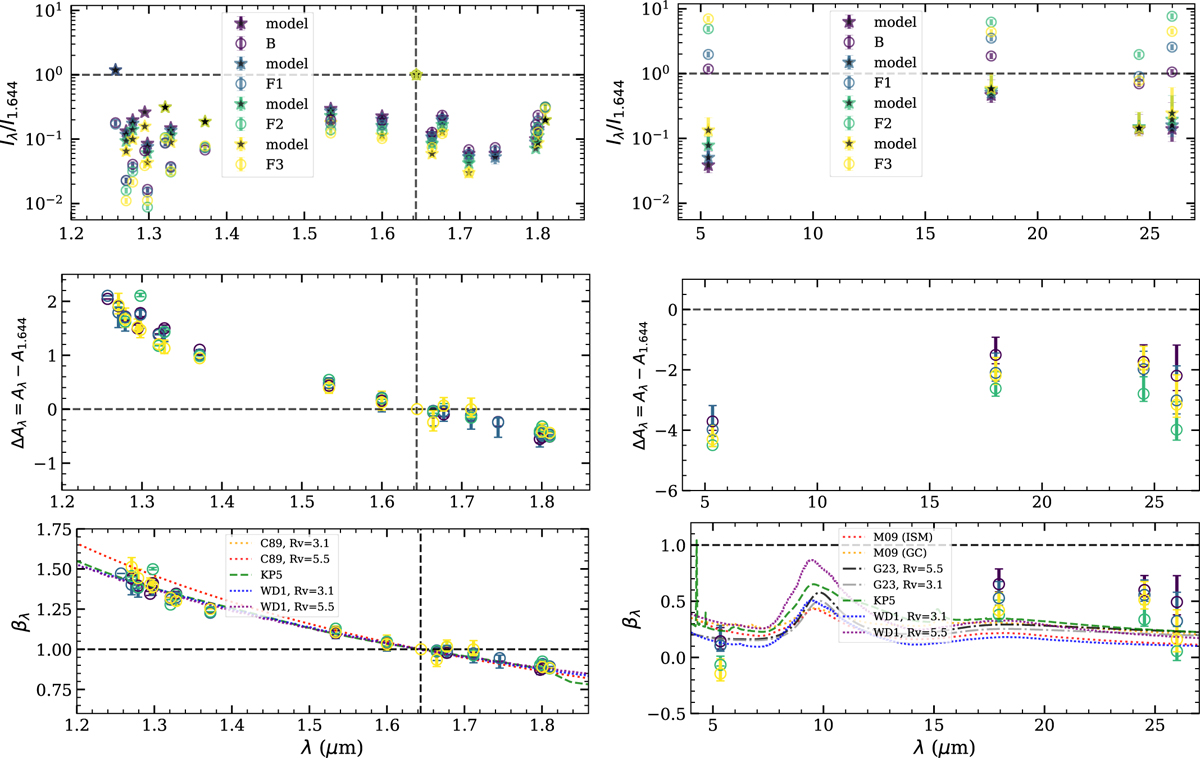
NIR and MIR extinction toward the TMC1A jet. Same as Figure 2, but extended to include additional a4D lines in the NIR (left) used for ne derivation, along with MIR lines (right). Model scatter points correspond to the derived electron density at 10 000 K (see Section 4.2), with uncertainties reflecting the uncertainty range in the determined ne value and temperatures from 5000–10 000 K. Commonly used NIR/MIR extinction curves are overplotted for comparison (see text).
Current usage metrics show cumulative count of Article Views (full-text article views including HTML views, PDF and ePub downloads, according to the available data) and Abstracts Views on Vision4Press platform.
Data correspond to usage on the plateform after 2015. The current usage metrics is available 48-96 hours after online publication and is updated daily on week days.
Initial download of the metrics may take a while.