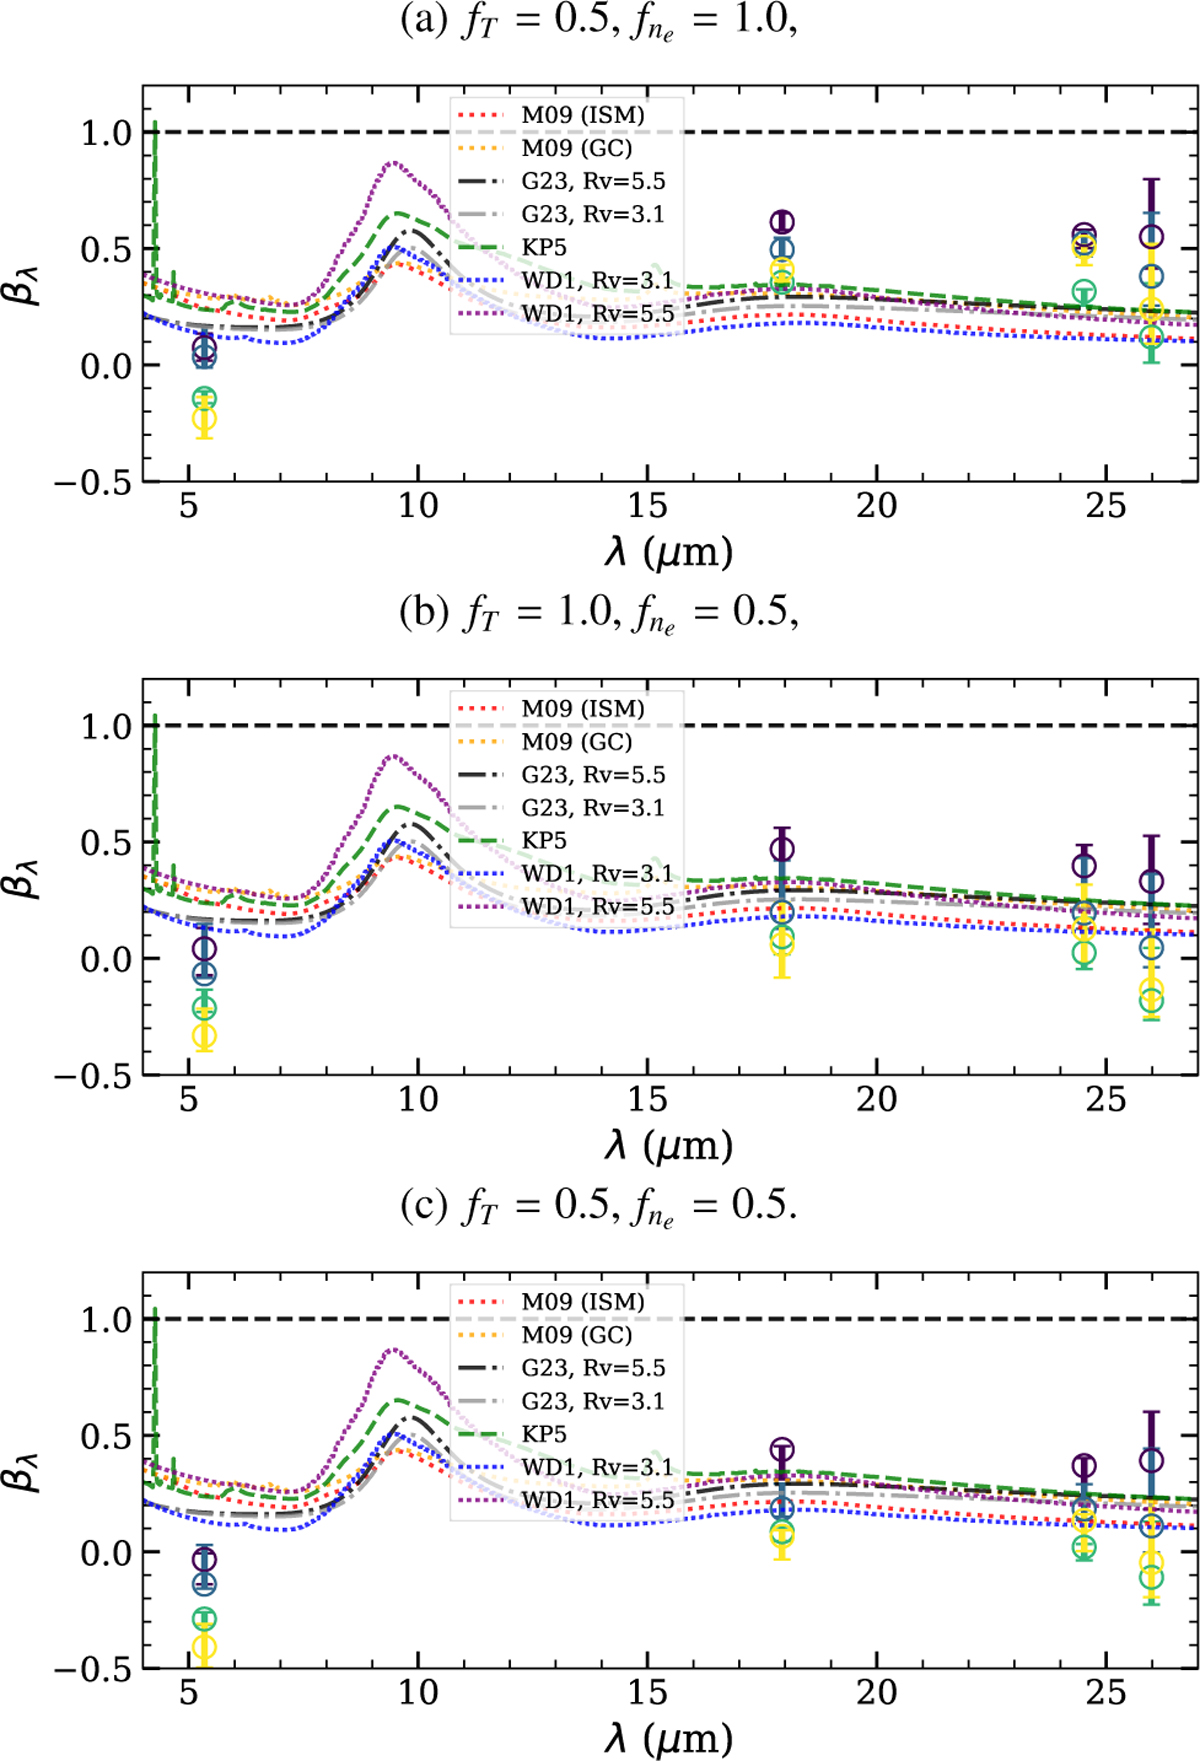
Fig. 6
Download original image
Derived MIR extinction from [Fe II] lines (λ > 5 µm) tracing different excitation conditions compared to NIR [Fe II] lines. The plots show MIR extinction, where MIR [Fe II] lines trace different excitation conditions (ne, Te) than NIR [Fe II] lines. Top: βλ values assuming MIR line intensities correspond to gas at half the NIR-traced temperature (fT = 0.5) with the same electron density (![]() ). Middle: same temperature as NIR-traced gas (ƒT = 1.0), but assuming MIR lines trace half the electron density (
). Middle: same temperature as NIR-traced gas (ƒT = 1.0), but assuming MIR lines trace half the electron density (![]() ). Bottom: both temperature and electron density are halved (ƒT = 0.5,
). Bottom: both temperature and electron density are halved (ƒT = 0.5, ![]() ).
).
Current usage metrics show cumulative count of Article Views (full-text article views including HTML views, PDF and ePub downloads, according to the available data) and Abstracts Views on Vision4Press platform.
Data correspond to usage on the plateform after 2015. The current usage metrics is available 48-96 hours after online publication and is updated daily on week days.
Initial download of the metrics may take a while.