Fig. 11
Download original image
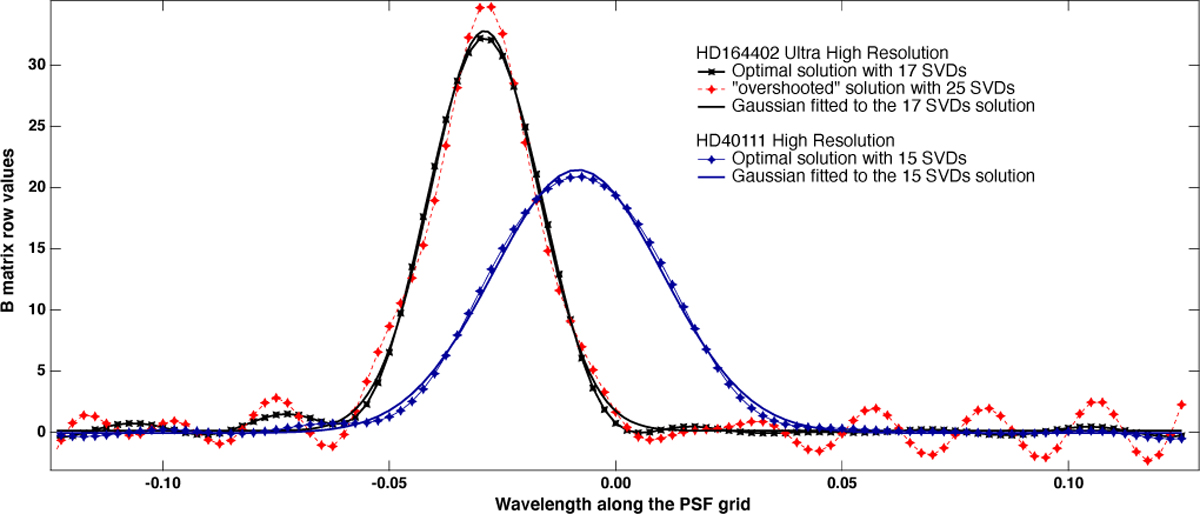
Instrumental function profile (black curve and markers) for the ESPRESSO UHR spectrum of HD 164402 and 17 SVs (corresponding to the bottom dot-dashed black line in Fig. 10), and the associated Gaussian fit. We show the profile computed for 25 SVs superposed (red dots). An oscillatory pattern is clearly visible, suggesting that this number of SVs is already too large. Also displayed are the 15 SVs optimal profile for the ESPRESSO HR spectrum of HD 40111 and its corresponding Gaussian fit.
Current usage metrics show cumulative count of Article Views (full-text article views including HTML views, PDF and ePub downloads, according to the available data) and Abstracts Views on Vision4Press platform.
Data correspond to usage on the plateform after 2015. The current usage metrics is available 48-96 hours after online publication and is updated daily on week days.
Initial download of the metrics may take a while.