Fig. 13
Download original image
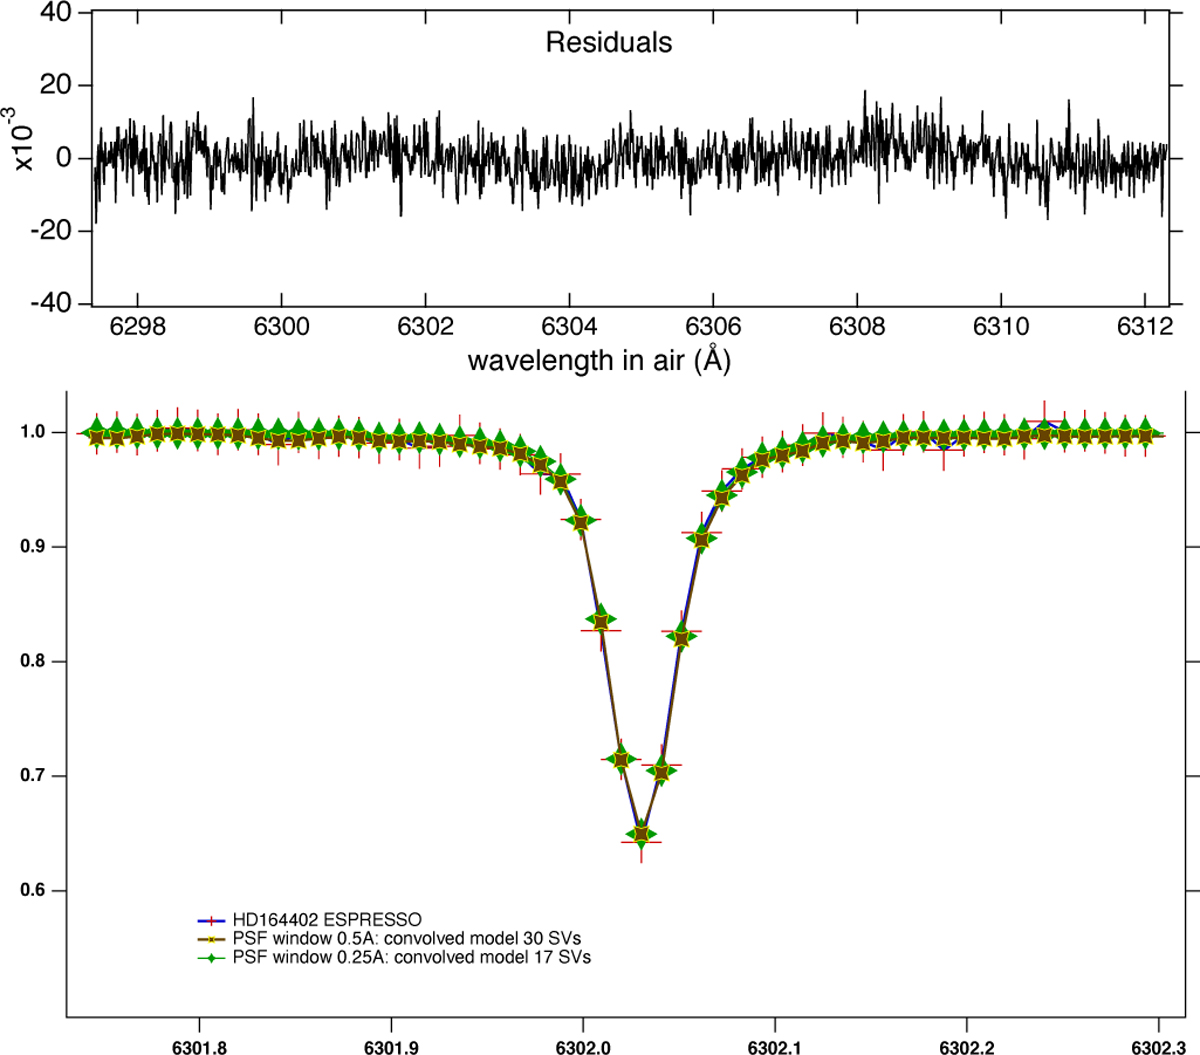
Top: differences between the HD 164402 ultrahigh-resolution data and the TAPAS model after its convolution by the profile of the 17 SVs solution. The comparison with Figure 8 shows that there are no marked residuals at the locations of the telluric lines. Bottom: zoom into one of the lines in the UHR spectrum. In addition to the model convolved by the 17 SVs profile (green curve and dots), the result of the convolution by the 30 SVs profile is represented (red curve and plus signs). The two solutions are similar, but the former results in a slightly more regular continuum, demonstrating its superiority.
Current usage metrics show cumulative count of Article Views (full-text article views including HTML views, PDF and ePub downloads, according to the available data) and Abstracts Views on Vision4Press platform.
Data correspond to usage on the plateform after 2015. The current usage metrics is available 48-96 hours after online publication and is updated daily on week days.
Initial download of the metrics may take a while.