Fig. 3
Download original image
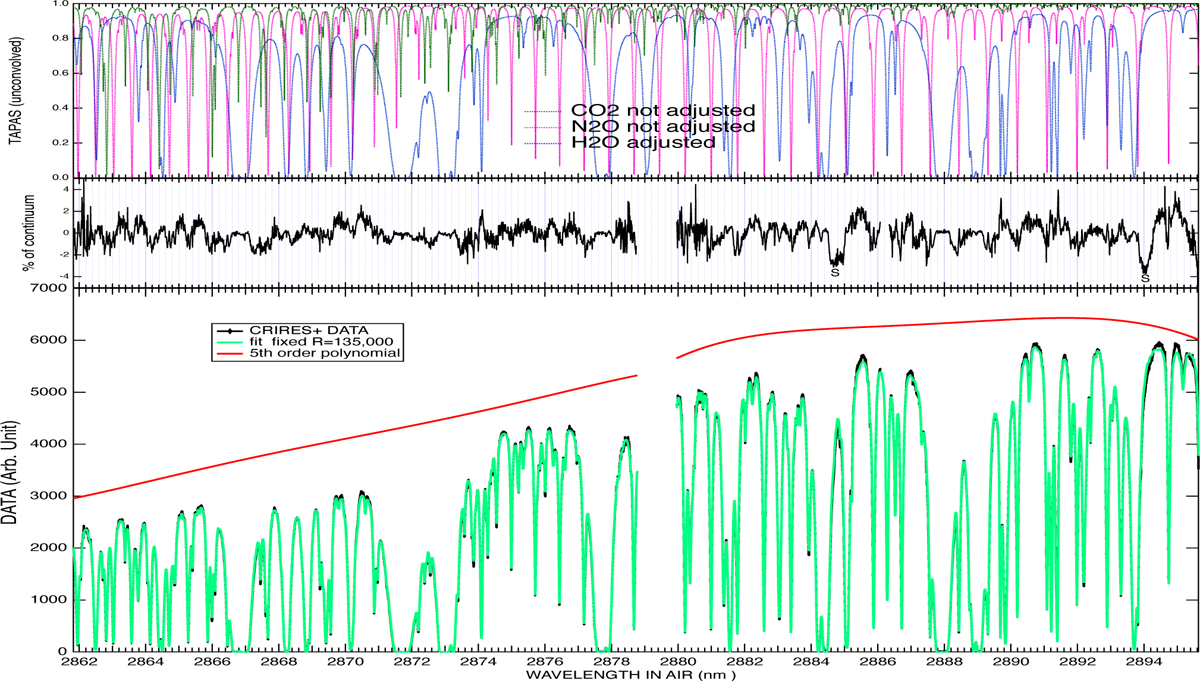
Example of the comparison between TAPAS predictions and a CRIRES spectrum of the hot star β CMa. Top: three transmittance spectra of H2O, N2O, and CO2 computed by TAPAS and before convolution are shown (right scale). Bottom: Data (in black) fit to the product of their convolved product by a fifth-order polynomial (green curve). The fit polynomial is displayed separately (red curve). The central gap in the data is due to the transition between the second and third detector of the instrument. Middle: differences between the data and the model expressed as the percentage of the fit continuum. The two broad and shallow features marked by S cannot be residual telluric features and are very likely stellar.
Current usage metrics show cumulative count of Article Views (full-text article views including HTML views, PDF and ePub downloads, according to the available data) and Abstracts Views on Vision4Press platform.
Data correspond to usage on the plateform after 2015. The current usage metrics is available 48-96 hours after online publication and is updated daily on week days.
Initial download of the metrics may take a while.