Fig. 4
Download original image
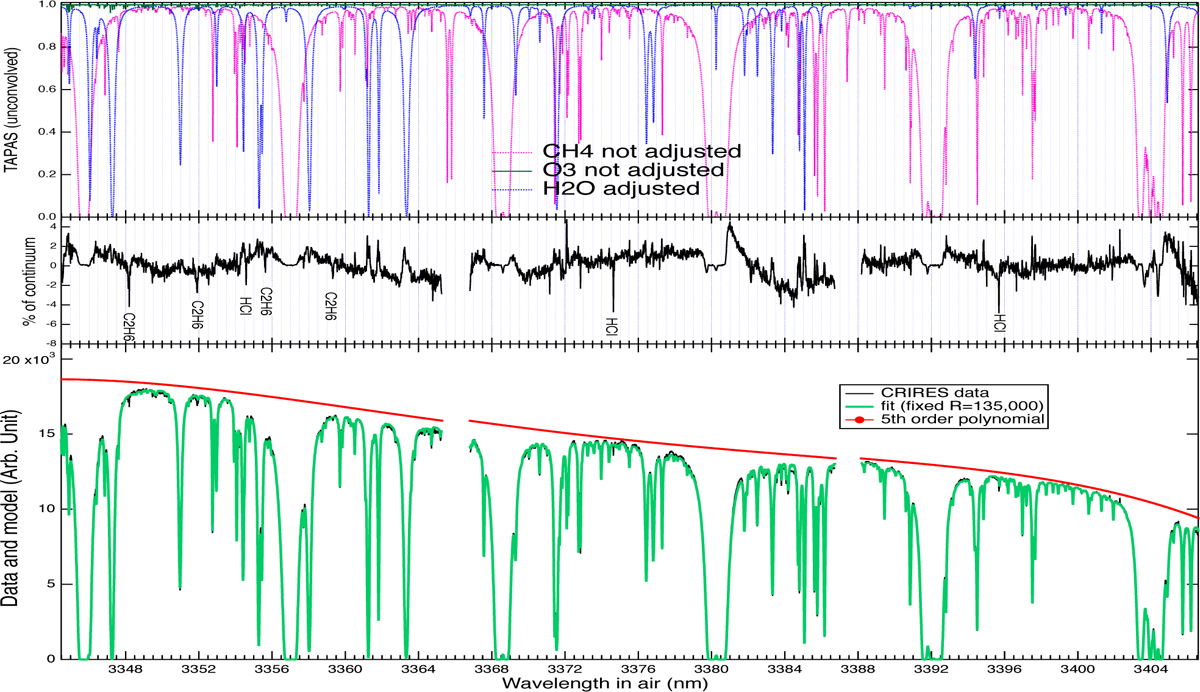
Same as Fig. 3 for a different spectral interval characterized by absorption lines of H2O, CH4, and O3. Top: TAPAS transmittance spectra (right scale). Bottom: data (in black) fit to the product of their convolved product by a fifth-order polynomial (green curve). The fit polynomial is displayed separately (red curve). The two data gaps are due to the transitions between the detectors of the instrument. Middle: differences between the data and the model expressed as the percentage of the fit continuum. A few weak and sharp absorption lines are absent from the model and were identified as due to C2H6 and HCl (see text).
Current usage metrics show cumulative count of Article Views (full-text article views including HTML views, PDF and ePub downloads, according to the available data) and Abstracts Views on Vision4Press platform.
Data correspond to usage on the plateform after 2015. The current usage metrics is available 48-96 hours after online publication and is updated daily on week days.
Initial download of the metrics may take a while.