Open Access
Fig. 9
Download original image
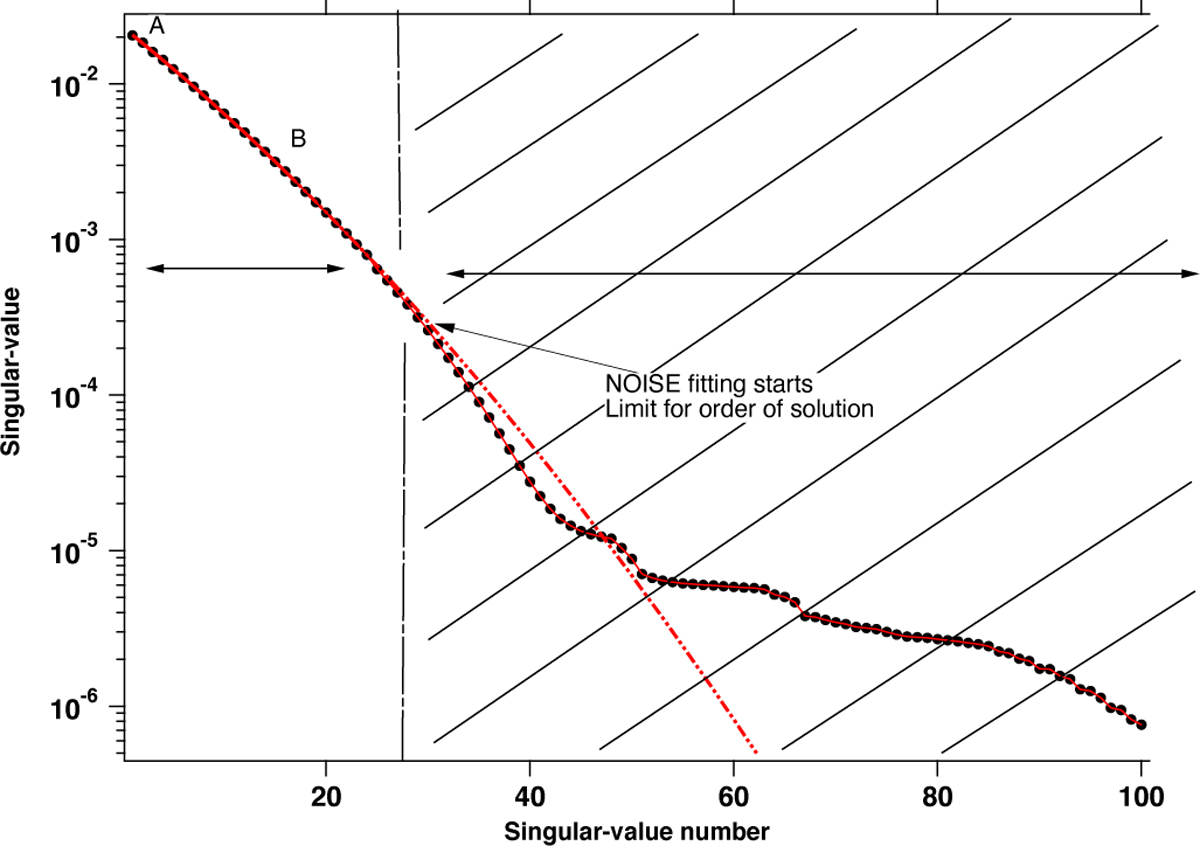
SVs of the diagonal matrix. The first value is omitted. A second-order polynomial fit to the region delimited by points A and B is shown in red. The SVs start to depart from this function at an SV number of about 30. Beyond this region, SVs are very low and correspond to numerical noise fitting (see text).
Current usage metrics show cumulative count of Article Views (full-text article views including HTML views, PDF and ePub downloads, according to the available data) and Abstracts Views on Vision4Press platform.
Data correspond to usage on the plateform after 2015. The current usage metrics is available 48-96 hours after online publication and is updated daily on week days.
Initial download of the metrics may take a while.