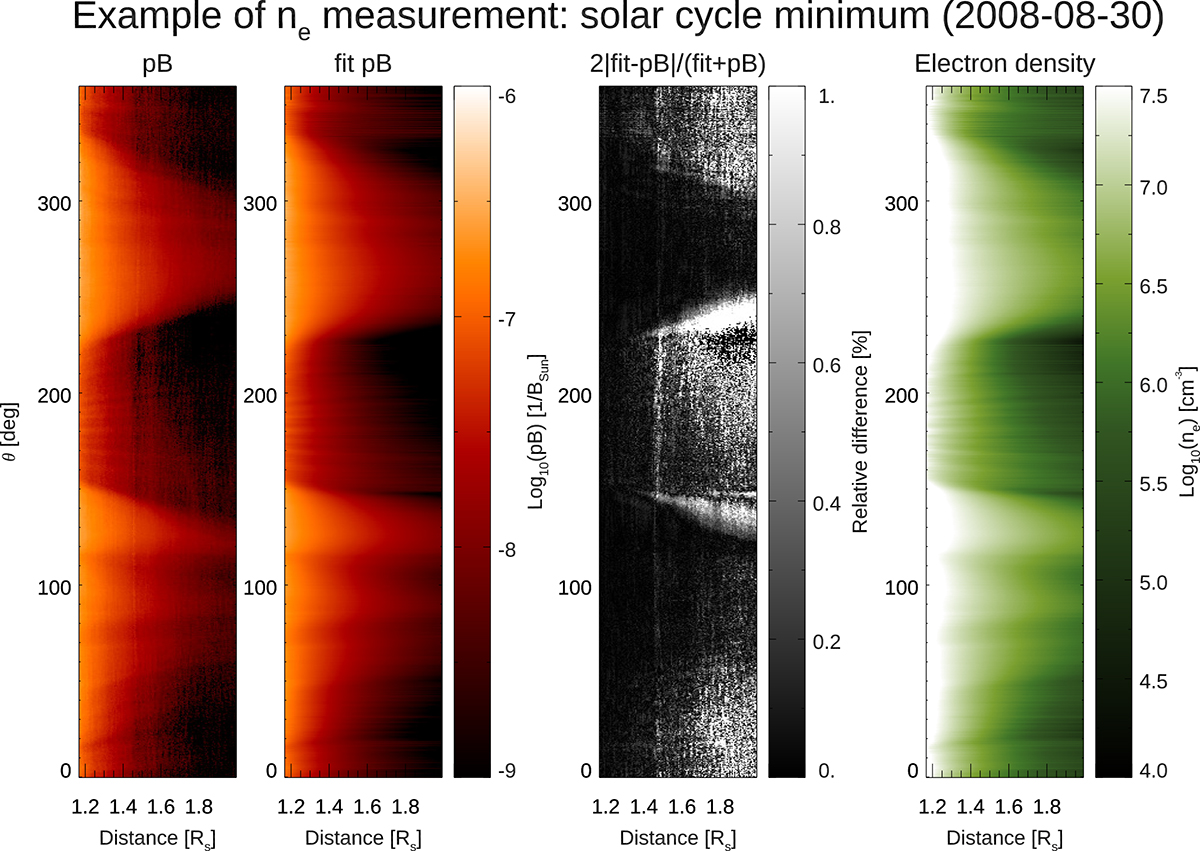
Fig. 1.
Download original image
Example of a daily pB image acquired by Mauna Loa on August 30, 2008. Left panel: Original pB data in polar coordinates (heliocentric distance on the x axis, polar angle measured counter-clockwise from the polar north on the y axis). Left-middle panel: Polar coordinates of the pB fit. Right-middle panel: Relative difference between the original data and fitted data. Right panel: Resulting electron density in polar coordinates.
Current usage metrics show cumulative count of Article Views (full-text article views including HTML views, PDF and ePub downloads, according to the available data) and Abstracts Views on Vision4Press platform.
Data correspond to usage on the plateform after 2015. The current usage metrics is available 48-96 hours after online publication and is updated daily on week days.
Initial download of the metrics may take a while.