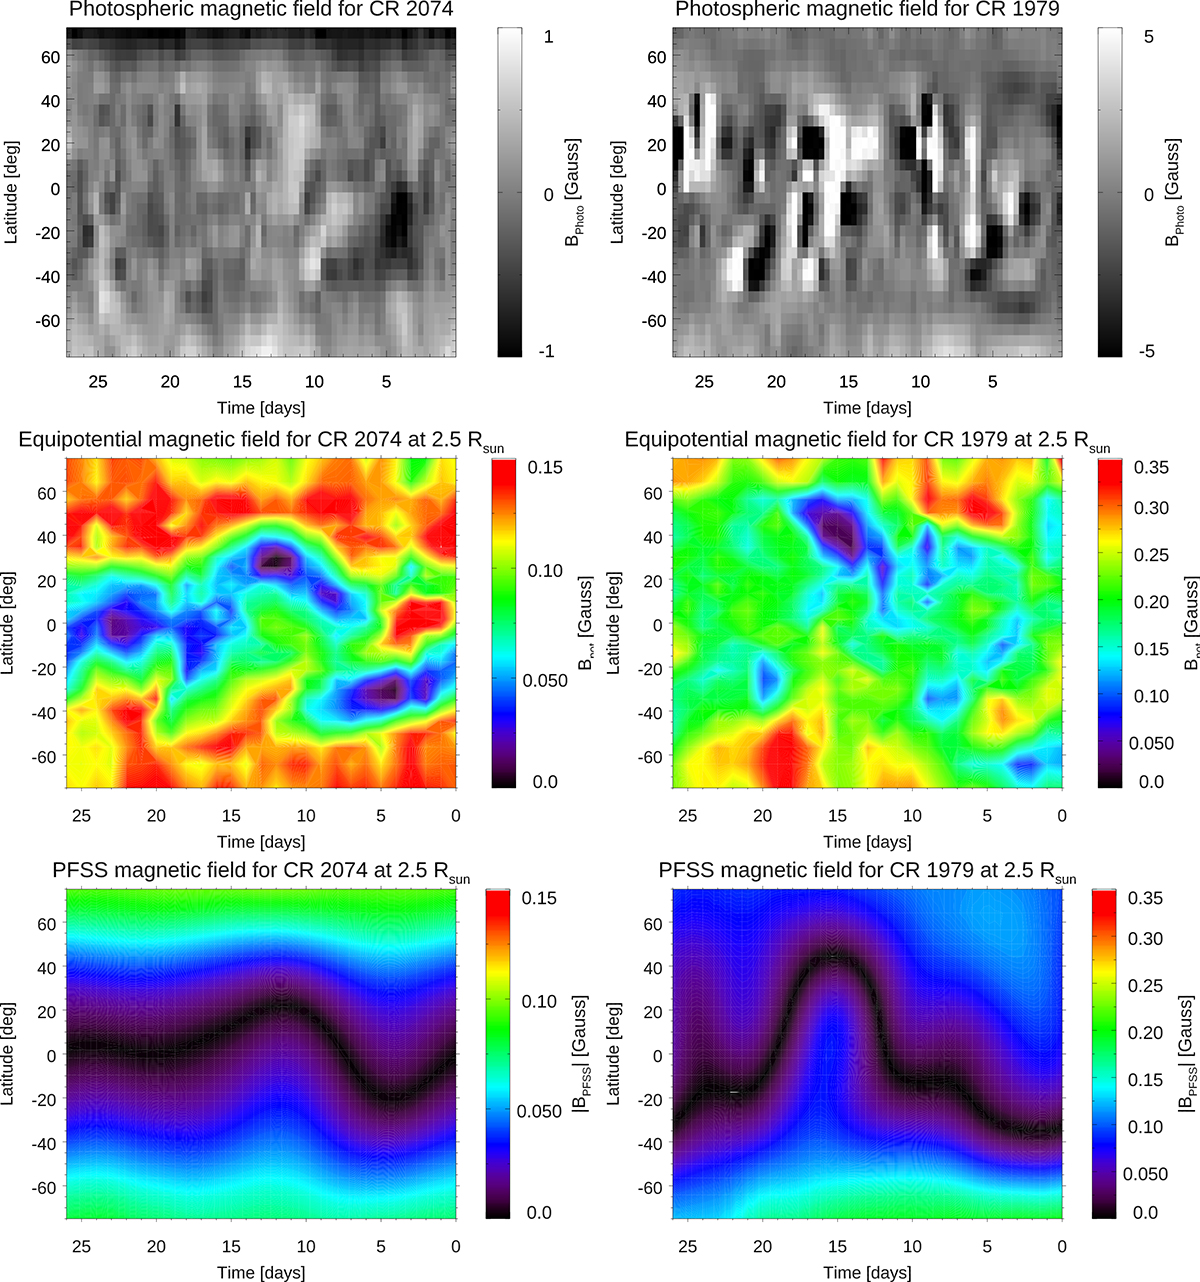
Fig. 3.
Download original image
Carrington maps of photospheric magnetic fields (top), coronal equipotential magnetic fields at 2.5 R⊙ (middle), and PFSS extrapolations (bottom) for CR 2074 (left column, solar minimum) and CR 1979 (right column, solar maximum). An animation of this figure available online shows the equipotential and PFSS magnetic fields in chronological order for all the CRs analysed in this work.
Current usage metrics show cumulative count of Article Views (full-text article views including HTML views, PDF and ePub downloads, according to the available data) and Abstracts Views on Vision4Press platform.
Data correspond to usage on the plateform after 2015. The current usage metrics is available 48-96 hours after online publication and is updated daily on week days.
Initial download of the metrics may take a while.