Fig. 1
Download original image
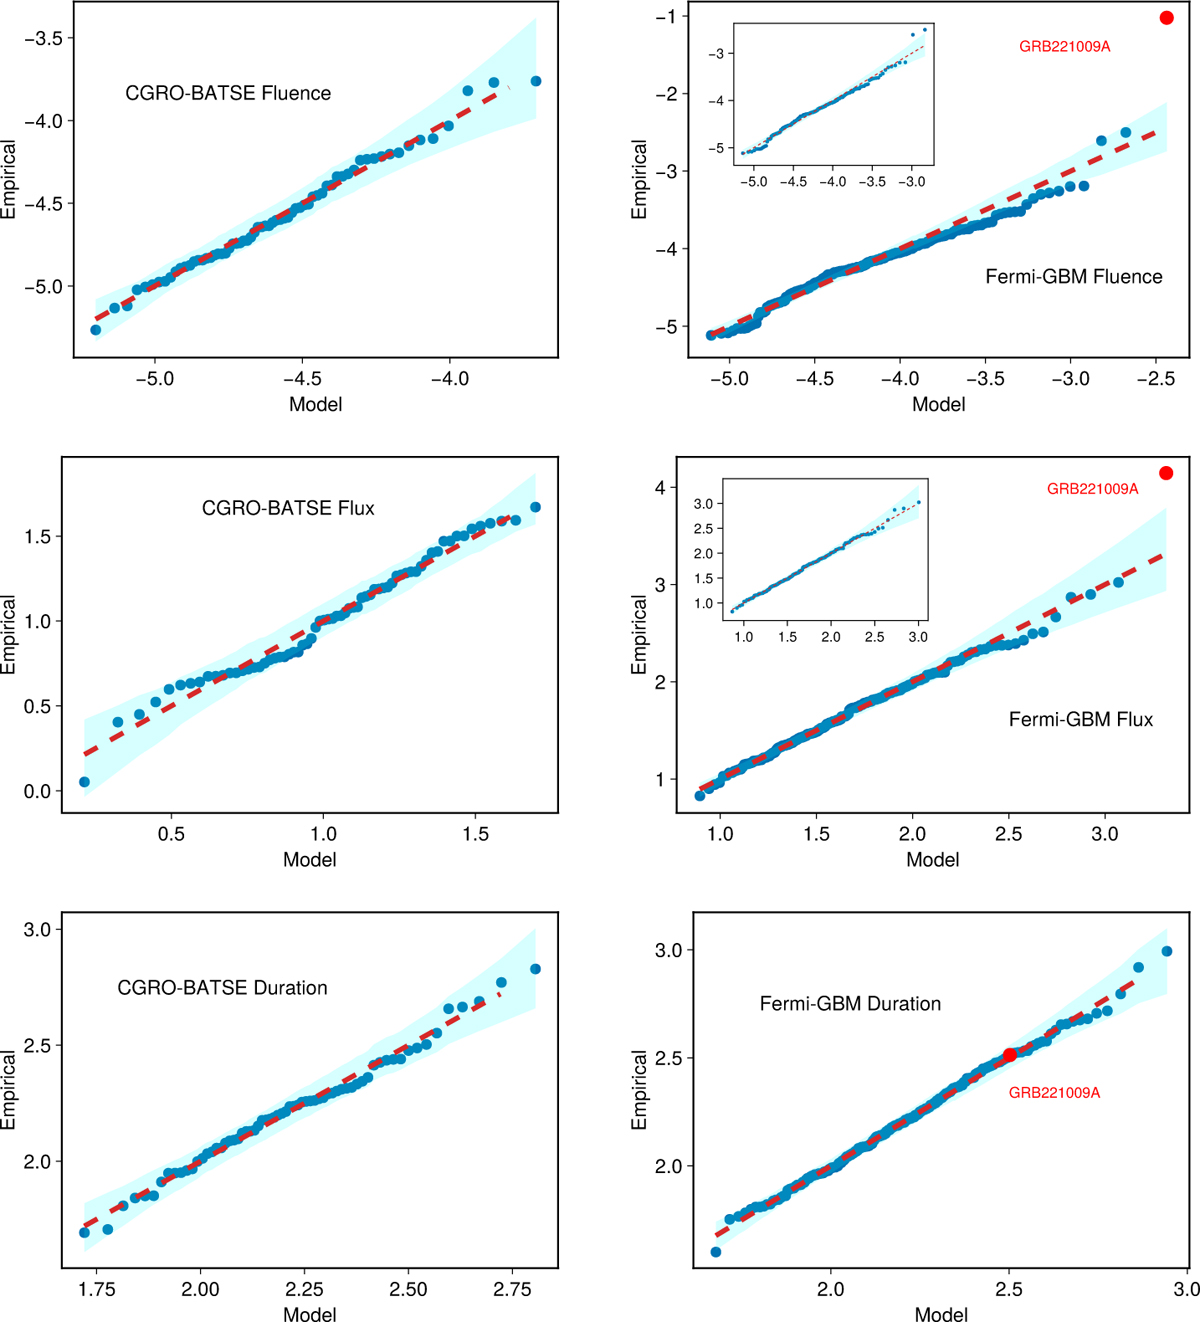
QQ plots for GEV fit of extreme values extracted from the duration (bottom), peak flux (middle), and fluence (top) of the CGRO-BATSE catalogue (left) and Fermi-GBM catalogue (right). The 95% credible region is also shown. GRB 221009A (red symbol) is clearly an outlier for the fluence and peak flux, but it is not for the duration. The insets show the results of the fit excluding GRB 221009A from the data set. GRB 230307A and GRB 130427A, respectively the second and third event with the highest fluence in the Fermi-GBM catalogue, are on the bright side, yet still consistent with GEV distribution (they are within the 99% credible region for a data set of 207 events).
Current usage metrics show cumulative count of Article Views (full-text article views including HTML views, PDF and ePub downloads, according to the available data) and Abstracts Views on Vision4Press platform.
Data correspond to usage on the plateform after 2015. The current usage metrics is available 48-96 hours after online publication and is updated daily on week days.
Initial download of the metrics may take a while.