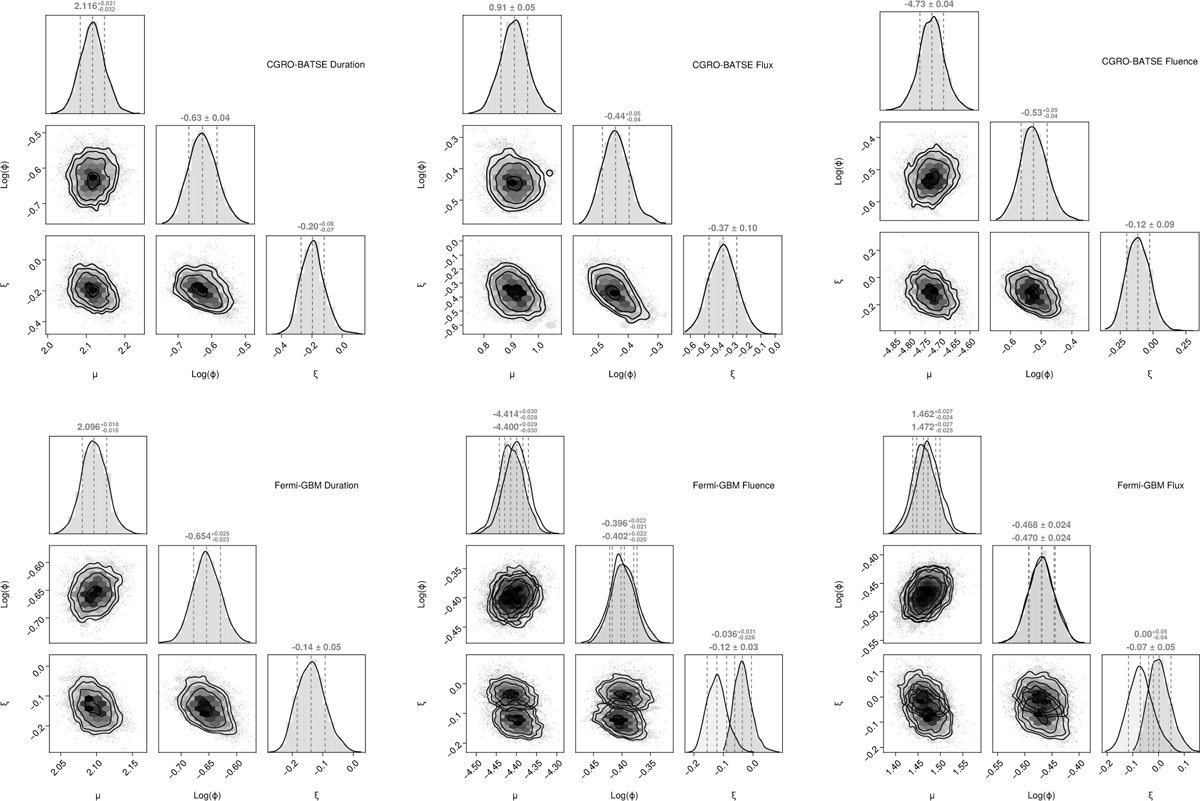
Fig. B.1
Download original image
Corner plots for the posterior distributions of the GEV parameters for data from the BATSE catalogue (top) and GBM catalogue (bottom). From the left to the right we have results for the duration, the peak flux and the fluence. The sampled parameters are the mean, μ, the scale, ϕ, and the shape, ξ of the GEV distribution. For the GBM dataset we carried out the analysis with or without the extreme GRB 221009A. The removal of this event affects only the GEV distributions for the fluence and peak flux.
Current usage metrics show cumulative count of Article Views (full-text article views including HTML views, PDF and ePub downloads, according to the available data) and Abstracts Views on Vision4Press platform.
Data correspond to usage on the plateform after 2015. The current usage metrics is available 48-96 hours after online publication and is updated daily on week days.
Initial download of the metrics may take a while.