Fig. 1.
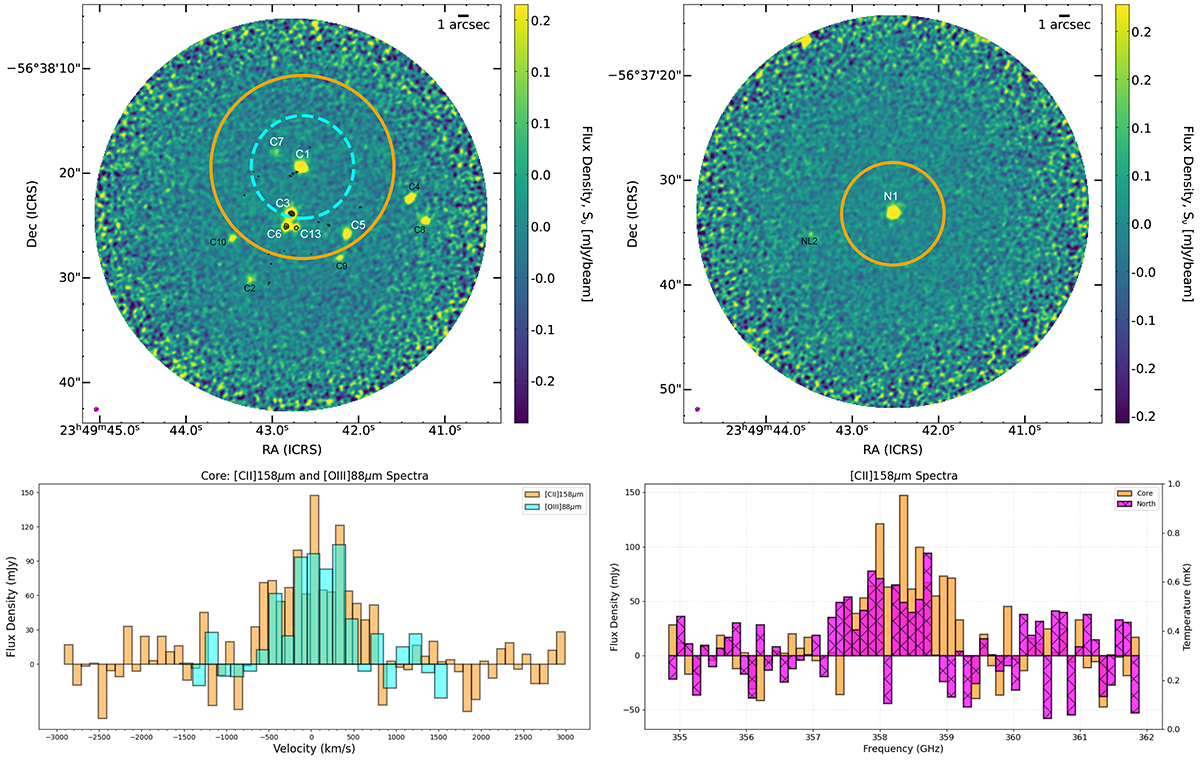
Download original image
ALMA Band 6 dust continuum emission from SPT2349-56, showing the core region (top left) and the north extension (top right) 45″ away. The pointing centre and instrument FWHM of APEX SEPIA345 (orange) and SEPIA660 (cyan) observations are overlaid. The Band 6 synthesised beam (magenta) is shown in the bottom-left of each panel. The black contours indicate ALMA Band 10 dust continuum detections towards the core region at signal-to-noise ratio levels of 3, 6, 10, and 15. Several continuum sources are labelled, as identified by Hill et al. (2020). Bottom left: The [C II] (orange; δV = 110 km s−1) and [O III] 88 μm (cyan; δV = 140 km s−1) spectra (Flux density vs. velocity, corrected using z = 4.304). Bottom right: The [C II] spectra (flux density or antenna temperature vs. frequency) shown for both observations of the core (orange; δV = 100 km s−1) and north (fuchsia; δV = 100 km s−1) fields.
Current usage metrics show cumulative count of Article Views (full-text article views including HTML views, PDF and ePub downloads, according to the available data) and Abstracts Views on Vision4Press platform.
Data correspond to usage on the plateform after 2015. The current usage metrics is available 48-96 hours after online publication and is updated daily on week days.
Initial download of the metrics may take a while.