| Issue |
A&A
Volume 701, September 2025
|
|
|---|---|---|
| Article Number | A298 | |
| Number of page(s) | 8 | |
| Section | Extragalactic astronomy | |
| DOI | https://doi.org/10.1051/0004-6361/202555071 | |
| Published online | 24 September 2025 | |
Extended multi-phase gas reservoirs in the z = 4.3 protocluster SPT2349-56: Non-stellar ionisation sources?
1
Joint ALMA Observatory, Alonso de Córdova 3107, Vitacura, Casilla, 19001 Santiago de Chile, Chile
2
National Astronomical Observatory of Japan, Los Abedules 3085 Oficina 701, Vitacura, 763 0414 Santiago, Chile
3
European Southern Observatory, Alonso de Córdova 3107, Vitacura, Casilla 19001 Santiago de Chile, Chile
4
Instituto de Estudios Astrofísicos, Facultad de Ingeniería y 455 Ciencias, Universidad Diego Portales, Av. Ejército Libertador 441, Santiago, Chile
5
Cornell Center for Astrophysics and Planetary Sciences, Cornell University, Ithaca, NY 14853, USA
6
Department of Physics & Astronomy, University of British Columbia, 6224 Agricultural Road, Vancouver, BC V6T 1Z1, Canada
7
European Southern Observatory, Karl-Schwarzschild-Strasse 2, 85748 Garching, Germany
8
Department of Physics, Section of Astrophysics, Astronomy and Mechanics, Aristotle University of Thessaloniki, 54124 Thessaloniki, Greece
9
Research Center for Astronomy, Academy of Athens, Soranou Efesiou 4, 11527 Athens, Greece
10
Max Planck Institute für Astrophysik, Karl-Schwarzschild-Strasse 1, 85748 Garching, Germany
11
Research Center for Astronomical Computing, Zhejiang Laboratory, Hangzhou 311000, China
⋆ Corresponding author: This email address is being protected from spambots. You need JavaScript enabled to view it.
Received:
7
April
2025
Accepted:
28
July
2025
Abstract
We aim to characterise the multi-phase gas in the SPT2349-56 protocluster at z = 4.3, which is known to host one of the most starbursting and Active Galactic Nuclei (AGN)-rich high redshift environments. For this purpose, we conducted Atacama Pathfinder EXperiment (APEX) single-dish observations of the [C II] 158 μm (hereafter [C II]) line towards the core and north components, which were previously imaged with the Atacama Large Millimeter/submillimeter Array (ALMA). We also present the first [O III] 88 μm (hereafter [O III]) line observations in such a high-redshift protocluster system. We obtain a [C II] line luminosity approximately 1.7 times greater than that recovered by ALMA towards the core, while we recover four times more [C II] line emission than that found in deep ALMA images towards the north component. This suggests that the most massive gas reservoirs lie in the less extreme regions of this protocluster system. A minimum ionised gas mass of Mmin(H+)∼3.7 × 10¹⁰ M⊙ is deduced from the [O III] line, which amounts to 30% of the molecular gas mass in the same area, indicating that a full map of the cluster is necessary for determining the large-scale value. Finally, we obtain star formation rate (SFR) estimates using the [O III] line luminosity and the corresponding ionised gas mass. These yield values that can surpass the far-infrared (IR) continuum-derived SFR under the assumption of a standard stellar Initial Mass Function (IMF), which can be reconciled only if non-stellar ionising sources contribute to the [O III] line luminosity, or if a top-heavy stellar IMF produces a larger fraction of O stars per total stellar mass. This is a distinct possibility in high-energy-particle (HEP)-dominated, rather than UV-photon-dominated, environments in clusters. Future work using far-IR fine-structure and molecular or neutral-atomic lines is necessary to determine the thermal and ionisation states of the multi-phase medium in this protocluster, to understand their maintenance, and to resolve the apparent SFR discrepancy. These line ratios must be measured over a wide range of spatial scales, from individual galaxies up to circumgalactic medium (CGM) and intracluster medium (ICM) scales, which ultimately requires combining wide-field single-dish and high-resolution interferometric observations of such lines in protocluster environments where HEP- and UV-dominated ISM phases can co-exist.
Key words: stars: massive / galaxies: clusters: general / galaxies: high-redshift / galaxies: star formation / submillimeter: ISM
© The Authors 2025
 Open Access article, published by EDP Sciences, under the terms of the Creative Commons Attribution License (https://creativecommons.org/licenses/by/4.0), which permits unrestricted use, distribution, and reproduction in any medium, provided the original work is properly cited.
This article is published in open access under the Subscribe to Open model. This email address is being protected from spambots. You need JavaScript enabled to view it. to support open access publication.
1. Introduction
Distant protoclusters, which are the precursors to modern-day galaxy clusters, are unique laboratories for cosmological structure formation and galaxy evolution across cosmic time (Overzier 2016; Alberts & Noble 2022). Galaxy assembly and star formation, both in situ (within galaxies) and ex situ (within dark matter haloes but beyond the luminous extent of galaxies), in protoclusters require mechanisms to effectively cool the gas and aid its gravitational collapse. Importantly, unlike the interstellar medium (ISM) within galaxies, the thermal or ionisation states of the intracluster medium (ICM) and circumgalactic medium (CGM) gas phases in clusters may not be far-UV radiation-controlled but may instead be dominated by high energy particles (HEPs) (Ferland et al. 2008, 2009; Lim et al. 2017). Unfortunately, in such HEP-dominated environments, where CO, the main tracer of H2, can be effectively destroyed, yielding [C I] and [C II]-rich gas phases (Bisbas et al. 2015, 2017, 2021; Bisbas et al. 2025). In these conditions, CO marks only denser sub-regions, which are surrounded by otherwise CO-poor, ([C I]/[C II])-rich H2 gas reservoirs (Papadopoulos et al. 2018). A CGM H2 gas reservoir that is C-rich (but relatively CO-poor), with an extent of ≈50 kpc, has already been identified in the protocluster around the Spiderweb galaxy at z = 2.2 (see e.g. Emonts et al. 2018; Chen et al. 2024), requiring long integrations of faint [C I] (1-0) and CO(1-0) line emission. This system was recently confirmed to be embedded in a hot ICM via the Sunyaev Zel’dovich effect (Di Mascolo et al. 2023). Furthermore, cold H2 gas streams traced by the [C I] (1-0) line emission, extending across 100 kpc, have been shown to fuel 4C 41.17, a massive radio galaxy at z = 3.8 (Emonts et al. 2023). Thus, there is a clear need to study the colder (T ∼ (20–100) K) gas phase (see e.g. Dannerbauer et al. 2017). This cold phase is expected alongside the warmer (∼104–106 K) ICM-CGM gas in protoclusters, with the former being the readily available fuel for their starburst activity in the early Universe.
Far-IR fine-structure lines can dominate the cooling energy budget within the cold neutral and ionised ISM (see e.g. Spinoglio et al. 2012; Fernández-Ontiveros et al. 2016), with [C II] often considered the dominant coolant, as it traces both neutral and ionised gas (Stacey et al. 2010; Vallini et al. 2015; Gullberg et al. 2015; Lagache et al. 2018; Cormier et al. 2019). Nevertheless, [O III] 88 μm (hereafter [O III]) line emission is often just as bright, while its high ionisation potential (IP) makes it suitable for tracing solely the fully ionised gas phase1. In the ISM of galaxies, the [O III] line emission originates from compact (and therefore young) H II regions around massive stars (Cormier et al. 2012; Vallini et al. 2017; Vishwas et al. 2018; Arata et al. 2020). However, such emission has been difficult to observe even at high redshift due to poor atmospheric transmission at its wavelength. Space-based observations of [C II] and [O III] in local metal-poor systems yielded L[O III]/![Mathematical equation: $ L_{[\mathrm{C}\,{\small { {\text{ II}}}}]} $](/articles/aa/full_html/2025/09/aa55071-25/aa55071-25-eq1.gif) ∼ 1 (Madden et al. 2013), although such line ratios are difficult to interpret, as the two lines trace vastly different thermal and ionisation states. Indeed, [C II] dominates the cooling budget of the neutral ISM in many local starbursts (De Looze et al. 2014; Díaz-Santos et al. 2017), even as H II regions and a diffuse low-ionisation phase can contribute ∼10% to its luminosity in metal-poor ISM. Yet, given the low IP value of neutral carbon (∼11.3 eV), it cannot trace the same phase as the [O III] line (∼35.1 eV for O++). Indeed, with a higher IP where [O III] is abundant, carbon would not remain in a singly ionised state (the IP for C+ is ∼24.4 eV). Standard photoionisation codes such as CLOUDY (Ferland et al. 2017) naturally yield a multiplicity of thermal and ionisation states within their 1D gas columns, irradiated by stellar or Active Galactic Nuclei (AGN) spectral energy distributions, yet they require more than a single line ratio as input to give any useful results.
∼ 1 (Madden et al. 2013), although such line ratios are difficult to interpret, as the two lines trace vastly different thermal and ionisation states. Indeed, [C II] dominates the cooling budget of the neutral ISM in many local starbursts (De Looze et al. 2014; Díaz-Santos et al. 2017), even as H II regions and a diffuse low-ionisation phase can contribute ∼10% to its luminosity in metal-poor ISM. Yet, given the low IP value of neutral carbon (∼11.3 eV), it cannot trace the same phase as the [O III] line (∼35.1 eV for O++). Indeed, with a higher IP where [O III] is abundant, carbon would not remain in a singly ionised state (the IP for C+ is ∼24.4 eV). Standard photoionisation codes such as CLOUDY (Ferland et al. 2017) naturally yield a multiplicity of thermal and ionisation states within their 1D gas columns, irradiated by stellar or Active Galactic Nuclei (AGN) spectral energy distributions, yet they require more than a single line ratio as input to give any useful results.
Both the [C II] and [O III] lines are accessible to observations in one of the most distant protocluster systems found, namely SPT2349-56 at z = 4.304. This protocluster was originally detected in the South Pole Telescope (SPT) 2500 deg2 millimeter(mm)-survey (Vieira et al. 2010; Mocanu et al. 2013), and spectroscopically confirmed by Strandet et al. (2016) using CO(4-3) and [C II] from the Atacama Pathfinder EXperiment (APEX) telescope after follow-up of the brightest 870 μm detections with the Large APEX BOlometer CAmera (LABOCA; Kreysa et al. 2003; Siringo et al. 2009). The dust continuum maps from LABOCA initially revealed a central source and a northern extension. Subsequent Atacama Large Millimeter/submilleter Array (ALMA) observations identified ∼29 CO(4-3)/[C II]emitting objects spread over a few hundred kiloparsecs (proper distance) towards the core and northern extension, with an estimated global star formation rate (SFR) of ∼104 M⊙ yr−1 (Miller et al. 2018; Hill et al. 2020, 2022). Here, we present new [C II] and [O III] observations in SPT2349-56 that are sensitive to large-scale gas distributions in and around the protocluster members, where previous interferometric measurements with ALMA of [C II] in the core and north may have resolved out the corresponding line emission, as suggested by Zhou et al. (2025). We describe the APEX and ALMA measurements in Sect. 2, our results and discussion are presented in Sects. 3 and 4. We provide a brief outlook in Sect. 5 that further motivates the need for sensitive single-dish measurements to study such protocluster systems at high redshift. Throughout this work, we adopt a standard ΛCDM cosmology: H0 = 70 km s−1 Mpc−1, Ωm = 0.3 and ΩΛ = 0.7.
2. Observations and data reduction
2.1. APEX [C II] and [O III] line measurements
The APEX telescope is a 12-m single-dish telescope located on the Chajnantor Plateau in the Atacama Desert in northern Chile. APEX observations targeted both the [C II] and [O III] emission lines using the known redshift z = 4.304 and coordinates, as first reported in Strandet et al. (2016) and Miller et al. (2018). The ‘core’ pointing in the observations corresponds most closely to object C1 in Hill et al. (2020, Core: RA:23:49:42.65, Dec:−56:38:19.4). We also report novel observations of [C II] line emission from the ‘north’ system located ∼45″ away (north; RA: 23:49:42.53, Dec: −56:37:33.2). Figure 1 shows the APEX full width at half maximum (FWHM) of the primary beam for each pointing, overlaid on the dust continuum emission from ALMA Band 6 (1 mm) measurements (Sect. 2.2) for both the core and north regions. The [O III] 88 μm measurements are the first observations of this fine-structure line in the core. Both lines are observable within favourable atmospheric windows at ∼358 GHz and ∼640 GHz for each line. The [C II] and [O III] lines were observed with the SEPIA345 (Meledin et al. 2022) and SEPIA660 (Baryshev et al. 2015) instruments2 respectively, between August 31 and September 6 2024 (Project ID: C-0114.F-9704-2024; PI: K. Harrington), during stable nighttime conditions. Precipitable water vapour (PWV) varied between ∼0.5–0.8 mm for SEPIA345 (Meledin et al. 2022), the single-pixel, dual-polarisation, 2-sideband (SB; 4-GHz per upper and lower sideband) heterodyne receiver. Excellent observing conditions with PWV < 0.5 mm enabled higher frequency observations with SEPIA660 (Baryshev et al. 2015), which has the same receiver design as SEPIA345. All observations were performed within the APEX control system (Muders et al. 2006), with data recorded using the MPIfR eXtended bandwidth fast Fourier transform spectrometers (FFTS; Klein et al. 2006). Each scan was reduced and analysed using GILDAS: Grenoble Image and Line Data Analysis Software3. The baseline stability strongly depends on the observed frequency and/or weather conditions. We first subtracted a first-order baseline from the emission line-free channels, guided by the known ∼1600 km s−1 extent of the line profile (Miller et al. 2018; Hill et al. 2020), at native resolution. We smoothed the baseline-subtracted spectrum before averaging to produce the final spectrum, obtaining a root mean square (RMS) sensitivity of 0.3–0.6 mK (at 90–110 km s−1 channel resolution) at ∼358 GHz, and 0.3–0.4 mK (at 110–150 km s−1 channel resolution) at ∼640 GHz. Using the APEX telescope efficiencies of 46.4 Jy K−1 and 59.5 Jy K−1 at 358.4 GHz and 639.7 GHz, respectively4, we scaled to a measured flux density. We then integrated across each line profile to calculate line luminosities (Table 1; e.g. Solomon & Vanden Bout 2005; Carilli & Walter 2013 and references therein for the formalism used). The total uncertainties of around 15–20% arise primarily from the flux calibration, pointing and focus, and baseline subtraction errors.
APEX single-dish measurements of [C II] and [O III] lines.
 |
Fig. 1. ALMA Band 6 dust continuum emission from SPT2349-56, showing the core region (top left) and the north extension (top right) 45″ away. The pointing centre and instrument FWHM of APEX SEPIA345 (orange) and SEPIA660 (cyan) observations are overlaid. The Band 6 synthesised beam (magenta) is shown in the bottom-left of each panel. The black contours indicate ALMA Band 10 dust continuum detections towards the core region at signal-to-noise ratio levels of 3, 6, 10, and 15. Several continuum sources are labelled, as identified by Hill et al. (2020). Bottom left: The [C II] (orange; δV = 110 km s−1) and [O III] 88 μm (cyan; δV = 140 km s−1) spectra (Flux density vs. velocity, corrected using z = 4.304). Bottom right: The [C II] spectra (flux density or antenna temperature vs. frequency) shown for both observations of the core (orange; δV = 100 km s−1) and north (fuchsia; δV = 100 km s−1) fields. |
2.2. ALMA Band 6 and Band 10 dust continuum
In this work, we utilised ALMA dust continuum measurements to identify the protocluster galaxy members with respect to the [C II] and [O III] line emission measurements from APEX detections. Band 10 (Uzawa et al. 2013) dust continuum measurements were recently obtained at 875–900 GHz (PID 2024.1.01465.S; PI: K. Harrington) from ALMA 12-m observations conducted between October 12 and November 6 2024 under excellent conditions: PWV and phase RMS 0.3 mm and < 15 μm, respectively. We obtained calibrated measurement sets of the two observations by rerunning the ALMA pipeline on the raw data, using CASA (McMullin et al. 2007). We then inspected the pipeline weblog and concluded that sufficient flagging had been applied, before imaging using the tclean task in CASA with all spectral windows and an auto-multithresh (Kepley et al. 2020) cutoff, resulting in an RMS of approximately 0.7 mJy beam−1. Three objects were detected, with more observational details described in Appendix A (Table A.1). We also used archival ALMA 12-m imaging from observations conducted on September 1 2022 of the core and north in Band 6 (PID 2021.1.01313.S; PI: R. Canning). We utilised the pipeline products available from the ALMA archive to plot a continuum image from 223–240 GHz (Fig. 1).
3. Results
3.1. Excess [C II] line emission
The SPT2349-56 protocluster at z ∼ 4.3 consists of multiple member galaxies concentrated in a northern and southern spatial configuration (Fig. 1, Fig. B.1). The APEX [C II] observation towards the southern region, i.e. the core, suggests that these single-dish measurements capture the [C II] line emission from 19 out of 23 objects presented in deep ALMA 12-m observations (∼0.2 mJy beam−1 per 13 km s−1 channel resolution) presented in Hill et al. (2020). The sum of the [C II] line fluxes for all 19 objects detected with the ALMA 12-m array, excluding objects ‘C2,C4,C8,C19’5, results in ∫ΔVSν([C II])dV ∼ 60 Jy km s−1 (Hill et al. 2020). To evaluate whether ALMA interferometric observations have filtered out extended [C II] beyond the maximum resolvable scale (∼5–6″) and sensitivities probed by both Miller et al. (2018) and Hill et al. (2020), we compared the individual [C II] line fluxes obtained from interferometry and those from single-dish observations of the core. The APEX [C II] measurements (Table 1) indicate a total line flux greater than 100 Jy km s−1, i.e. about 1.7 times the line emission compared to ALMA. Based on the luminosity function discussed in Hill et al. (2020) and comparing the sensitivity of the ALMA observations, we estimate that no more than 10–15% of the excess flux can be attributed to low-luminosity galaxies that are within the (relatively small) beam, but undetected with ALMA.
In addition, we present the first single-dish observation towards the north region (Table 1), centred on object ‘N1’ as presented in Hill et al. (2020). Our north pointing consists of a single central object in the archival Band 6 continuum and [C II]. Hill et al. (2020) report that this object (‘N1’) has ∫ΔVSν([C II])dV = 18.9 Jy km s−1. We measure a [C II] line flux of 80 Jy km s−1 from APEX observations, i.e. four times the [C II] line emission measured by deep ALMA observations. Indeedamente, the largest nongalaxy-bound reservoir of [C II]-emitting gas in the SPT2349-56 protocluster lies in the north. Moreover, the north component [C II] emission amounts to nearly 80% of that of the core component, yet it contains only one [C II] line emitter. The combined core and north [C II] line luminosity (∼11 × 1010 L⊙) amounts to ∼0.14% of the total IR luminosity of the entire protocluster, LIR∼8 × 10¹³ L⊙ (Strandet et al. 2016; Miller et al. 2018; Hill et al. 2020). The factor of 1.7 times the [C II] line emission from the core already indicates the presence of a significant amount of gas (possibly located between these systems) around the core members. Additional faint objects revealed in deep ALMA measurements by Hill et al. (2020) resulted in the detection of multiple new objects and fainter emission surrounding some of the objects within the core (< 1 Jy km s−1) that were not originally detectable by Miller et al. (2018). The fainter objects increased the total ALMA-detected [C II] line intensity by only ∼10–15 Jy km s−1 for the same area covered by APEX. This suggests that the factor of 1.7 increased [C II] emission in the core does not come from the recently detected faint [C II]-emitting systems, but from an ICM-CGM phase, with the excess [C II] emission being even more pronounced in the north component.
3.2. First [O III] 88 μm line detection in a z > 1 protocluster
The [O III] 88 μm line was first detected in the early Universe in two composite galaxies with both AGN and starburst activity (Ferkinhoff et al. 2010). In the local Universe, it is thought to be powered solely by O star radiation fields (e.g. Cormier et al. 2012; Lambert-Huyghe et al. 2022 and references therein), even though its critical density (ne, crit ∼ 510 cm−3) and low excitation potential (E10/kB ∼ 163 K) allow it to remain luminous at lower temperatures and densities of ionised gas beyond the immediate vicinity and/or inside young, compact H II regions. Within such regions, this line is insensitive to the much higher local temperatures and is nearly LTE-excited for ne ≳ 103 cm−3. The [O III] emission in the core has line fluxes and profiles comparable to those of the [C II] line (Figure 1), as observed in other known cases of dusty star-forming galaxies (De Breuck et al. 2019). The [O III] line has a similar luminosity to [C II] despite covering an area roughly three times smaller in the pointing6 (Figs. 1, A.1), with L[O III]/![Mathematical equation: $ L_{[\mathrm{C}\,\mathrm{\textsc{ii}}]} $](/articles/aa/full_html/2025/09/aa55071-25/aa55071-25-eq2.gif) = 1.3 and L[O III] = (8.3 ± 1.7)×1010 L⊙; yet, as noted in Sect. 1, these two lines trace different gas phases altogether. We can nevertheless use the [O III] frequency-integrated flux density, F10, to obtain the minimum amount of ionised hydrogen gas, given by
= 1.3 and L[O III] = (8.3 ± 1.7)×1010 L⊙; yet, as noted in Sect. 1, these two lines trace different gas phases altogether. We can nevertheless use the [O III] frequency-integrated flux density, F10, to obtain the minimum amount of ionised hydrogen gas, given by
![Mathematical equation: $$ \begin{aligned} \mathrm{M}_{\rm min}(\mathrm{H}^+) = \mathrm{F}_{10} \left[\frac{4\pi \mathrm{D}^2 _{\rm L}}{(\mathrm{g}_1/\mathrm{Z}(\mathrm{T}_{\rm e})\, \mathrm{e}^{-\mathrm{E}_1/\mathrm{k}_{\rm B} \mathrm{T}_{\rm e}}) \mathrm{A}_{10} \mathrm{h} \nu _{10} } \right]\frac{\mathrm{m}_{\rm H}}{\mathrm{X}(\mathrm{O}^{++})}, \end{aligned} $$](/articles/aa/full_html/2025/09/aa55071-25/aa55071-25-eq3.gif) (1)
(1)
where ![Mathematical equation: $ \mathrm{n}_1=\mathrm{N}_{1}/\mathrm{N}_{\mathrm{tot}}= [\mathrm{g}_1/\mathrm{Z}(\mathrm{T}_{\mathrm{e}})] \mathrm{e}^{-\mathrm{E}_1/\mathrm{k}_{\mathrm{B}} \mathrm{T}_{\mathrm{e}}} $](/articles/aa/full_html/2025/09/aa55071-25/aa55071-25-eq4.gif) is the occupation number of the upper level (for LTE), Z(Te) is the three-level partition function, A10 = 2.7 × 10⁻⁵ s−1 is the Einstein coefficient for spontaneous emission, ν10 = 3393.00624 GHz is the line frequency, and
is the occupation number of the upper level (for LTE), Z(Te) is the three-level partition function, A10 = 2.7 × 10⁻⁵ s−1 is the Einstein coefficient for spontaneous emission, ν10 = 3393.00624 GHz is the line frequency, and  is the fractional abundance of oxygen in the doubly ionised state. For hot plasma,
  , and for all oxygen atoms in the doubly ionised state (i.e.
  ; assumed Milky Way value) we obtain
 (2)
(2)
where L10 the line luminosity, which yields Mmin(H+)∼3.7 × 10¹⁰ M⊙. Sub-thermal line excitation, cooler plasma, optical depth effects reducing the observed [O III] line intensity, or oxygen atoms at a lower ionisation state, will all increase the actual M(H+). This minimum ionised gas mass already amounts to 30% of the molecular gas masses reported for the sum of all objects within the APEX beam (Hill et al. 2020, see Table 3). The question then arises whether the high [O III] line (and the large implied ionised gas mass) can be explained as the outcome of the total IR-derived SFR for the core. The APEX [O III] observations cover less than a third of the 23 core objects. Estimates of the IR-derived SFR from these objects yields SFR ∼ 2500 M⊙ yr−1, while the larger core area within 300 kpc (proper distance), containing all 23 objects, has a total IR-derived SFR of ∼5000 M⊙ yr−1(Hill et al. 2020).
4. Discussion
In this section, we discuss the significance of the single-dish [C II] and [O III] line detections. We first derive an independent SFR estimate from the [O III] line luminosity. As mentioned above, the [O III] line typically traces star-forming regions in the vicinity of intense ionisation sources owing to the requirement of 35.1 eV photons to produce O2+. In deriving this SFR and comparing it with the known IR-derived SFR, we can explore whether the [O III]-deduced SFR is sufficiently high to suggest significant non-stellar contributions to the observed [O III] line luminosity from other sources in or around individual star-forming galaxies within SPT2349-56.
It can be shown that for only stellar types O5.5V or above, produce sufficient ionising flux to keep He doubly ionised (requires 24.6 eV) throughout the Strömgren sphere (e.g. Draine 2011). Therefore, the presence of such stars is essential for attributing the observed [O III] luminosity to star formation activity. First, we estimate the number of representative O5.5 class V stars, whose typical bolometric luminosity is 105.41 L⊙ (see Table 1 in Martins et al. 2005). Metal lines are the primary coolants of photoionised gas, emitting approximately 1% of the incident bolometric luminosity. Therefore, we adopt ϵO = 1% to convert the observed [O III] luminosity into the expected bolometric luminosity of the stars responsible for keeping the gas ionised, ![Mathematical equation: $ L_{[\mathrm O{\small { {\text{ III}}}}]} $](/articles/aa/full_html/2025/09/aa55071-25/aa55071-25-eq9.gif) /ϵO= NO5.5V× LO5.5V. This results in ∼32.3 million O5.5V stars. Using STARBURST99 (Leitherer et al. 1999) stellar population synthesis models, we find that a continuous star formation episode with SFR = 1 M⊙ yr−1, sustained over 6–8 Myr, results in approximately 104.35 O stars. These models count all stars 15.6 M⊙ as O-stars. Calculating the integral over the IMF used for SB997 between Mlow = 34.4 M⊙ to Mup = 100 M⊙, yields a fraction of stars O5.5V or greater as f(%> O5.5V M⊙)= 28.57%. We therefore derive a scaling between an SFR = 1 M⊙ yr−1 and NO5.5V = f(%> O5.5V M⊙)N(O stars, 1 M⊙ yr−1) ∼ 6400, as expressed by the following independent [O III] 88 μm-derived equation for the SFR, which uses the known properties of O stars and the STARBURST99 models closest to solar metallicity (Z = 0.02):
/ϵO= NO5.5V× LO5.5V. This results in ∼32.3 million O5.5V stars. Using STARBURST99 (Leitherer et al. 1999) stellar population synthesis models, we find that a continuous star formation episode with SFR = 1 M⊙ yr−1, sustained over 6–8 Myr, results in approximately 104.35 O stars. These models count all stars 15.6 M⊙ as O-stars. Calculating the integral over the IMF used for SB997 between Mlow = 34.4 M⊙ to Mup = 100 M⊙, yields a fraction of stars O5.5V or greater as f(%> O5.5V M⊙)= 28.57%. We therefore derive a scaling between an SFR = 1 M⊙ yr−1 and NO5.5V = f(%> O5.5V M⊙)N(O stars, 1 M⊙ yr−1) ∼ 6400, as expressed by the following independent [O III] 88 μm-derived equation for the SFR, which uses the known properties of O stars and the STARBURST99 models closest to solar metallicity (Z = 0.02):
 (3)
(3)
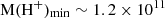
which gives  M⊙ yr−1, exceeding the 2500 M⊙ yr−1 value estimated for this area of the protocluster (Hill et al. 2020). The OIII-deduced SFR would be even higher if the assumed metallicity were lower, further exaggerating the discrepancy.
The previous equation demonstrates that the OIII-deduced SFR may be equal to or even exceed the total IR-derived SFR. Therefore, we provide an independent estimate of the formation rate of O stars from the [O III]-deduced H+ mass reservoir, requiring two assumptions: (a) this reservoir consists solely of young ultra-compact H II (UCHII) regions around O5–O7 stars (those with a high ionisation parameter U sufficient to maintain the O++ ionisation state); (b) these stars are replenished in a steady-state manner by an equal mass of molecular gas (copious amounts of which have been detected in this protocluster; (e.g. Zhou et al. 2025)). Using the turbulence-regulated SF theory (Krumholz & McKee 2005), this replenishment occurs by collapsing dense gas cores on timescales  , thus:
 (4)
(4)
within the protocluster area sampled by the APEX beam. From turbulence-regulated star formation theory, the parameter f* = (SFRff)−1 ranges from 70–180, where  –0.014 is the normalised SFR per free-fall time Δtff (for core virial parameters of avir = 1.3–5; see Equations (21) and (30) in Krumholz & McKee 2005). Meanwhile,
 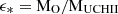 represents the O star mass per ionised gas mass of its UCHII region. For molecular cloud core densities of
 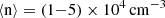 (typical of dense star-forming molecular gas), and ϵ* ∼ 0.65 (for a UCHII size of r ∼ 0.5 pc, using the ne-(2r) relation from Kim & Koo 2001 (Figure 9), and a mean mass of MO = 40 M⊙ for O6–O7 spectral types), we estimate
  (300–1700) M⊙ yr−1. This range already accounts for approximately 12–68% of the total, IR-derived SFR computed for this protocluster area assuming a standard stellar IMF. For a lower X(O++) = [O++/H+] = 0.3 × (O) = 1.77 × 10⁻⁴ abundance inside the H II regions (appropriate for O5.5 stars with H+ and He+ throughout their volume)8
 M⊙, raising the implied SFRO stars to ∼(1000–6000) M⊙ yr−1, which is at least 65% of and can even exceed the IR-derived total SFR (an obvious impossibility). These two independent arguments that estimate the OIII-deduced SFR suggest possible nonstellar contributions to the observed [O III] line luminosity or a top-heavy stellar IMF (a possible outcome of HEP-dominated ISM; Papadopoulos et al. 2011). These are important issues that will be addressed by future studies and spatially resolved analyses.
The APEX [O III] observations covered the region of the core, encompassing only three of the brightest galaxies initially discovered by Miller et al. (2018) (objects C1, C3, and C7; Hill et al. 2020). Objects C1 (Band 10 undetected) and C3 (Band 10 detected) are among the brightest reported individual [C II] emitters (Miller et al. 2018; Hill et al. 2020). However, C3 is associated with a known radio-loud AGN system composed of C3, C6, and C13, all detected in Band 10 and indicating a strong dust heating source. Subsequent X-ray observations indicate that C1 and C6 host AGN with roughly Compton-thick gas (NH ∼ 1024 cm−2; Chapman et al. 2024; Vito et al. 2024). The contribution of these galaxies to the APEX-observed [O III] luminosity remains uncertain, as does the existence of any extended [O III]-emitting ICM phase within the protocluster. Moreover, the systems detected in the ALMA Band 10 measurements (C3, C6, and C13; Fig. A.1) are dusty starbursts and could have significant optical depths even in the far-IR. Indeed, extreme dusty merger starbursts such as Arp 220 have been found to be optically thick out to 450 μm (Papadopoulos et al. 2010) and even 2.6 mm (Scoville et al. 2017), while the Red Radio Ring, a strongly lensed dusty star-forming galaxy (DSFG) at z = 2.6, appears optically thick out to 200 μm (Harrington et al. 2019). Any dust optical depth corrections or low-density ionised gas phase (sub-thermally exciting the [O III] line) in the protocluster would only increase the corresponding M(H+), thereby complicating its attribution solely to H II regions surrounding O stars (as these are produced by a standard IMF).
Luminosity ratios  have been observed previously in high-redshift starburst galaxies at z ∼ 6–9 (Harikane et al. 2020), exceeding values found in local starbursts and dwarf galaxies (Fujimoto et al. 2024 and references therein). In these high-redshift systems, where O-stars appear abundant, we would expect a richer release of O compared to C (which originates from lower-mass, longer-lived stars). This affects the C/O abundance ratio, creating the so-called α-enhanced ISM. An α-enhanced ISM may also exhibit high
  (Bisbas et al. 2024, 2025); however, it is not clear whether the ISM and ICM power sources are dominated by the star-formation-produced far-UV photons or are HEP-dominated instead. Recently, the environment around a known dusty star-forming galaxy at z = 2.8 was imaged by the James Webb Space Telescope (JWST), revealing 2.5 kpc filamentary structures of [O III] λλ4959, 5007 line emission extending out to 60 kpc beyond the host system (Peng et al. 2025), precisely tracing the previously imaged Lyman-α emission, indicating a shock-heated CGM. Solimano et al. (2025) report that radiative shocks are insufficient to power the [O III] λλ4959, 5007 line emission in a z ∼ 4.5 protocluster, and explored the possibility of outflows and AGN in powering these CGM-scale [O III]. Harikane et al. (2025) have recently analysed both singly and doubly ionised optical and far-IR oxygen lines, suggesting that the far-IR emission lines arise primarily from relatively low-density gas with electron densities around ne ∼ 100 cm
 . Moreover, far-UV photon-deficient thermal ISM states have been found to dominate large molecular gas reservoirs even within extreme dusty starbursts such as NGC 6240 (Papadopoulos et al. 2014), a distinct possibility also for ICM-CGM in galaxy clusters (Ferland et al. 2008, 2009; Lim et al. 2017). The initial conditions of star formation are strongly impacted by the dominant ISM heating source, which in turn affects the resulting in situ (galaxies) and ex situ (CGM-ICM) stellar IMF that builds up the stellar mass in the Universe.
The significance of the [C II] excess (1.4 times in the core and four times in the north compared with star-forming galaxies) is that it likely traces a diffuse CGM or a preheated proto-ICM, which may play a critical role in sustaining the high SFR observed. The larger [C II] excess in the north region could reflect variations in environmental conditions, but further investigation are needed to clarify its origin (see e.g. Fujimoto et al. 2019). Without spatially resolved observations of these emission lines, we can only speculate, but not definitely confirm, the source of ionising photons at this time, It is assumed that extended [O III] may be less likely than extended [C II], given the higher IP. Previous works have explored the possibility of extended [C II] halos around individual galaxies and merging systems using ALMA (e.g. Fujimoto et al. 2019; Ginolfi et al. 2020), while more recent single-dish observations have revealed even more spatially extended [C II] in protocluster systems (e.g. De Breuck et al. 2022). We provide evidence that [O III], having a much higher IP, exhibits a similar distribution, as inferred from the line width of [C II]. This raises the question of what causes the widespread [O III] line emission. Is widespread star formation enough to explain this, or must alternative mechanisms such as shock-driven excitation and/or widespread AGN activity be invoked, especially considering that there may be higher AGN activity in protoclusters (Vito et al. 2024; Shah et al. 2024), including SPT2349-56? This highlights the critical importance of using reliable ionised and neutral gas phase line ratio diagnostics to determine the thermal and ionisation states in extraordinary systems such as the SPT2349-56 protocluster in the early Universe.
5. Conclusions and outlook
Two new APEX single-dish measurements of the [C II] line in the SPT2349-56 protocluster reveal ∼1.7 times the [C II] line emission previously measured with ALMA 12-m observations of the core, while the [C II] detection from the north reveals roughly four times the [C II] line luminosity than detected by deep ALMA 12-m observations. Both results suggest the presence of additional amounts of ICM and/or CGM gas. An APEX [O III] line measurement towards the core revealed the presence of a large reservoir of O++, corresponding to a massive H+ gas reservoir. The latter is difficult to reconcile solely as the product of star formation in this intensely star-forming protocluster, unless non-stellar sources such as HEPs and/or strong shocks contribute to the CGM and ICM ionisation, or non-standard (top-heavy) stellar IMFs are considered. It is therefore imperative that the multi-phase CGM and/or ICM reservoir in this and other such extraordinary systems be studied both in its ionised and neutral gas phases, using appropriate line ratios reliably measured across scales ranging from individual galaxies up to large-scale CGM and/or ICM distributions. Such studies areimpossible with interferometers alone, due to short u-v spacing that filtered out large-scale emission, which biased the assessments of both the true mass of the CGM and ICM components and their thermal and chemical states. Our work demonstrates the necessity of overcoming these short-spacing issues in interferometric data by complimenting them with measurements of far-IR fine-structure lines with single-dish facilities. This further motivates the development of future facilities such as the Atacama Large Aperture Submillimeter Telescope (i.e. AtLAST; Mroczkowski et al. 2025), capable of accessing to the required high-frequency ranges without filtering out extended line emission.
Excitation potential Eul/kB ∼ 91 K and ∼163 K, and critical densities of ncrit(H) = 3 × 103 cm−3 (for H I and H2 as collisional partners) and  cm−3 for the [C II] and [O III] lines, respectively.
APEX Instruments Overview: https://www.apex-telescope.org/ns/observing-run/observing/the-telescope/instruments/
Software information can be found at: http://www.iram.fr/IRAMFR/GILDAS
These objects are not within the pointing of the primary beam (∼2–3″) of APEX.
Due to the differences in the beam size between 358 GHz and 640 GHz.
The value 0.3 is representative of the distribution between 0.2 to 0.6 in Figure 14 of Amayo et al. (2021).
Acknowledgments
The authors would like to pay respects to the passing of German Astronomer, Dr. Karl Menten: https://www.mpifr-bonn.mpg.de/announcements/2025/1. He was the founder of APEX, had an enormous influence in ensuring the development of the Atacama Large Millimeter/submillimeter Array, and has left a scientific legacy for years and years to come. For distinguished people, every sky is a shelter. The authors would like to thank the referee for their thoughtful comments and constructive review. The authors also thank Rob Ivison, Laya Ghodsi, Nick Foo, as well as Dazhi Zhou, Scott Chapman and Nikolaus Sulzenauer, for helpful comments and discussions. We would also like to thank all of the APEX team of operators, observers and staff for making these successful observations, including Juan-Pablo Perez-Beapuis, Manuel Merello, Felipe MacAuliffe, Claudio Agurto, Mauricio Martinez, Francisco Azagra, Pablo Garcia and Macarena Lopez. PPP would like to thank the ESO visitorship program that hosted him in the period November-March 2024–25, as well as Thorsten Naab and Bo Peng at MPA for the hospitality and the intense discussions. This work was supported by the European Southern Observatory through available travel funds for Fellows, which has been greatly appreciated by KCH. AWSM acknowledges the support of the Natural Sciences and Engineering Research Council of Canada (NSERC) through grant reference number RGPIN-2021-03046 and the ESO Visitor Program. The data were collected under the Atacama Pathfinder EXperiment (APEX) Project, led by the Max Planck Institute for Radio Astronomy at the ESO La Silla Paranal Observatory. This paper makes use of the following ALMA data: ADS/JAO.ALMA#2024.0.01465.S. ALMA is a partnership of ESO (representing its member states), NSF (USA) and NINS (Japan), together with NRC (Canada), NSTC and ASIAA (Taiwan), and KASI (Republic of Korea), in cooperation with the Republic of Chile. The Joint ALMA Observatory is operated by ESO, AUI/NRAO and NAOJ. TGB acknowledges support from the Leading Innovation and Entrepreneurship Team of Zhejiang Province of China (Grant No. 2023R01008).
References
- Alberts, S., & Noble, A. 2022, Universe, 8, 554 [Google Scholar]
- Amayo, A., Delgado-Inglada, G., & Stasińska, G. 2021, MNRAS, 505, 2361 [CrossRef] [Google Scholar]
- Arata, S., Yajima, H., Nagamine, K., Abe, M., & Khochfar, S. 2020, MNRAS, 498, 5541 [NASA ADS] [CrossRef] [Google Scholar]
- Asaki, Y., Maud, L. T., Fomalont, E. B., et al. 2020a, ApJS, 247, 23 [NASA ADS] [CrossRef] [Google Scholar]
- Asaki, Y., Maud, L. T., Fomalont, E. B., et al. 2020b, AJ, 160, 59 [Google Scholar]
- Asaki, Y., Maud, L. T., Francke, H., et al. 2023, ApJ, 958, 86 [NASA ADS] [Google Scholar]
- Baryshev, A. M., Hesper, R., Mena, F. P., et al. 2015, A&A, 577, A129 [NASA ADS] [CrossRef] [EDP Sciences] [Google Scholar]
- Bisbas, T. G., Papadopoulos, P. P., & Viti, S. 2015, ApJ, 803, 37 [NASA ADS] [CrossRef] [Google Scholar]
- Bisbas, T. G., van Dishoeck, E. F., Papadopoulos, P. P., et al. 2017, ApJ, 839, 90 [Google Scholar]
- Bisbas, T. G., Tan, J. C., & Tanaka, K. E. I. 2021, MNRAS, 502, 2701 [CrossRef] [Google Scholar]
- Bisbas, T. G., Zhang, Z.-Y., Gjergo, E., et al. 2024, MNRAS, 527, 8886 [Google Scholar]
- Bisbas, T. G., Zhang, Z.-Y., Kyrmanidou, M.-C., et al. 2025, A&A, 697, A115 [NASA ADS] [CrossRef] [EDP Sciences] [Google Scholar]
- Carilli, C. L., & Walter, F. 2013, ARA&A, 51, 105 [NASA ADS] [CrossRef] [Google Scholar]
- Chapman, S. C., Hill, R., Aravena, M., et al. 2024, ApJ, 961, 120 [NASA ADS] [CrossRef] [Google Scholar]
- Chen, Z., Dannerbauer, H., Lehnert, M. D., et al. 2024, MNRAS, 527, 8950 [Google Scholar]
- Cormier, D., Lebouteiller, V., Madden, S. C., et al. 2012, A&A, 548, A20 [NASA ADS] [CrossRef] [EDP Sciences] [Google Scholar]
- Cormier, D., Abel, N. P., Hony, S., et al. 2019, A&A, 626, A23 [NASA ADS] [CrossRef] [EDP Sciences] [Google Scholar]
- Dannerbauer, H., Lehnert, M. D., Emonts, B., et al. 2017, A&A, 608, A48 [NASA ADS] [CrossRef] [EDP Sciences] [Google Scholar]
- De Breuck, C., Weiß, A., Béthermin, M., et al. 2019, A&A, 631, A167 [NASA ADS] [CrossRef] [EDP Sciences] [Google Scholar]
- De Breuck, C., Lundgren, A., Emonts, B., et al. 2022, A&A, 658, L2 [CrossRef] [EDP Sciences] [Google Scholar]
- De Looze, I., Cormier, D., Lebouteiller, V., et al. 2014, A&A, 568, A62 [NASA ADS] [CrossRef] [EDP Sciences] [Google Scholar]
- Di Mascolo, L., Saro, A., Mroczkowski, T., et al. 2023, Nature, 615, 809 [NASA ADS] [CrossRef] [Google Scholar]
- Díaz-Santos, T., Armus, L., Charmandaris, V., et al. 2017, ApJ, 846, 32 [Google Scholar]
- Draine, B. T. 2011, Physics of the Interstellar and Intergalactic Medium (Princeton University Press) [Google Scholar]
- Emonts, B. H. C., Lehnert, M. D., Dannerbauer, H., et al. 2018, MNRAS, 477, L60 [NASA ADS] [CrossRef] [Google Scholar]
- Emonts, B. H. C., Lehnert, M. D., Yoon, I., et al. 2023, Science, 379, 1323 [NASA ADS] [CrossRef] [Google Scholar]
- Ferkinhoff, C., Hailey-Dunsheath, S., Nikola, T., et al. 2010, ApJ, 714, L147 [NASA ADS] [CrossRef] [Google Scholar]
- Ferland, G. J., Fabian, A. C., Hatch, N. A., et al. 2008, MNRAS, 386, L72 [NASA ADS] [Google Scholar]
- Ferland, G. J., Fabian, A. C., Hatch, N. A., et al. 2009, MNRAS, 392, 1475 [NASA ADS] [CrossRef] [Google Scholar]
- Ferland, G. J., Chatzikos, M., Guzmán, F., et al. 2017, Rev. Mex. Astron. Astrofis., 53, 385 [NASA ADS] [Google Scholar]
- Fernández-Ontiveros, J. A., Spinoglio, L., Pereira-Santaella, M., et al. 2016, ApJS, 226, 19 [CrossRef] [Google Scholar]
- Fujimoto, S., Ouchi, M., Ferrara, A., et al. 2019, ApJ, 887, 107 [Google Scholar]
- Fujimoto, S., Ouchi, M., Nakajima, N., et al. 2024, ApJ, 964, 1 [Google Scholar]
- Ginolfi, M., Jones, G. C., Béthermin, M., et al. 2020, A&A, 633, A90 [NASA ADS] [CrossRef] [EDP Sciences] [Google Scholar]
- Gullberg, B., De Breuck, C., Vieira, J. D., et al. 2015, MNRAS, 449, 2883 [Google Scholar]
- Harikane, Y., Ouchi, M., Inoue, A. K., et al. 2020, ApJ, 896, 93 [Google Scholar]
- Harikane, Y., Sanders, R. L., Ellis, R., et al. 2025, ApJ, submitted [arXiv:2505.09186] [Google Scholar]
- Harrington, K. C., Vishwas, A., Weiß, A., et al. 2019, MNRAS, 488, 1489 [NASA ADS] [CrossRef] [Google Scholar]
- Hill, R., Chapman, S., Scott, D., et al. 2020, MNRAS, 495, 3124 [NASA ADS] [CrossRef] [Google Scholar]
- Hill, R., Chapman, S., Phadke, K. A., et al. 2022, MNRAS, 512, 4352 [NASA ADS] [CrossRef] [Google Scholar]
- Kepley, A. A., Tsutsumi, T., Brogan, C. L., et al. 2020, PASP, 132, 024505 [Google Scholar]
- Kim, K.-T., & Koo, B.-C. 2001, ApJ, 549, 979 [Google Scholar]
- Klein, B., Philipp, S. D., Krämer, I., et al. 2006, A&A, 454, L29 [NASA ADS] [CrossRef] [EDP Sciences] [Google Scholar]
- Klein, T., Ciechanowicz, M., Leinz, C., et al. 2014, IEEE Trans. Terahertz Sci. Technol., 4, 588 [CrossRef] [Google Scholar]
- Kreysa, E., Bertoldi, F., Gemuend, H.-P., et al. 2003, in Millimeter and Submillimeter Detectors for Astronomy, eds. T. G. Phillips, & J. Zmuidzinas, SPIE Conf. Ser., 4855, 41 [Google Scholar]
- Krumholz, M., & McKee, C. F. 2005, ApJ, 630, 250 [NASA ADS] [CrossRef] [Google Scholar]
- Lagache, G., Cousin, M., & Chatzikos, M. 2018, A&A, 609, A130 [NASA ADS] [CrossRef] [EDP Sciences] [Google Scholar]
- Lambert-Huyghe, A., Madden, S. C., Lebouteiller, V., et al. 2022, A&A, 666, A112 [NASA ADS] [CrossRef] [EDP Sciences] [Google Scholar]
- Leitherer, C., Schaerer, D., Goldader, J. D., et al. 1999, ApJS, 123, 3 [Google Scholar]
- Lim, J., Dinh-V-Trung, Vrtilek, J., David, L. P., & Forman, W. 2017, ApJ, 850, 31 [CrossRef] [Google Scholar]
- Madden, S. C., Rémy-Ruyer, A., Galametz, M., et al. 2013, PASP, 125, 600 [NASA ADS] [CrossRef] [Google Scholar]
- Martins, F., Schaerer, D., & Hillier, D. J. 2005, A&A, 436, 1049 [NASA ADS] [CrossRef] [EDP Sciences] [Google Scholar]
- Maud, L. T., Asaki, Y., Fomalont, E. B., et al. 2020, ApJS, 250, 18 [Google Scholar]
- Maud, L. T., Asaki, Y., Dent, W. R. F., et al. 2022, ApJS, 259, 10 [Google Scholar]
- Maud, L. T., Asaki, Y., Nagai, H., et al. 2023, ApJS, 267, 24 [Google Scholar]
- McMullin, J. P., Waters, B., Schiebel, D., Young, W., & Golap, K. 2007, in Astronomical Data Analysis Software and Systems XVI, eds. R. A. Shaw, F. Hill, & D. J. Bell, ASP Conf. Ser., 376, 127 [Google Scholar]
- Meledin, D., Lapkin, I., Fredrixon, M., et al. 2022, A&A, 668, A2 [NASA ADS] [CrossRef] [EDP Sciences] [Google Scholar]
- Miller, T. B., Chapman, S. C., Aravena, M., et al. 2018, Nature, 556, 469 [CrossRef] [Google Scholar]
- Mocanu, L. M., Crawford, T. M., Vieira, J. D., et al. 2013, ApJ, 779, 61 [Google Scholar]
- Mroczkowski, T., Gallardo, P. A., Timpe, M., et al. 2025, A&A, 694, A142 [NASA ADS] [CrossRef] [EDP Sciences] [Google Scholar]
- Muders, D., Hafok, H., Wyrowski, F., et al. 2006, A&A, 454, L25 [NASA ADS] [CrossRef] [EDP Sciences] [Google Scholar]
- Overzier, R. A. 2016, A&ARv, 24, 14 [Google Scholar]
- Papadopoulos, P., Isaak, K., & van der Werf, P. P. 2010, ApJ, 711, 757 [Google Scholar]
- Papadopoulos, P. P., Thi, W.-F., Miniati, F., & Serena, V. 2011, MNRAS, 414, 1705 [NASA ADS] [CrossRef] [Google Scholar]
- Papadopoulos, P. P., Zhang, Z.-Y., Xilouris, E. M., et al. 2014, ApJ, 788, 153 [CrossRef] [Google Scholar]
- Papadopoulos, P. P., Bisbas, T. G., & Zhang, Z.-Y. 2018, MNRAS, 478, 1716 [NASA ADS] [CrossRef] [Google Scholar]
- Peng, B., Arrigoni Battaia, F., Vishwas, A., et al. 2025, A&A, 694, L1 [NASA ADS] [CrossRef] [EDP Sciences] [Google Scholar]
- Scoville, N., Murchikova, L., Walter, F., et al. 2017, ApJ, 836, 66 [Google Scholar]
- Shah, E. A., Lemaux, B. C., Forrest, B., et al. 2024, A&A, submitted [arXiv:2409.02996] [Google Scholar]
- Siringo, G., Kreysa, E., Kovács, A., et al. 2009, A&A, 497, 945 [NASA ADS] [CrossRef] [EDP Sciences] [Google Scholar]
- Solimano, M., González-López, J., Aravena, M., et al. 2025, A&A, 693, A70 [NASA ADS] [CrossRef] [EDP Sciences] [Google Scholar]
- Solomon, P. M., & Vanden Bout, P. A. 2005, ARA&A, 43, 677 [NASA ADS] [CrossRef] [Google Scholar]
- Spinoglio, L., Dasyra, K. M., Franceschini, A., et al. 2012, ApJ, 745, 171 [NASA ADS] [CrossRef] [Google Scholar]
- Stacey, G. J., Hailey-Dunsheath, S., Ferkinhoff, C., et al. 2010, ApJ, 724, 957 [NASA ADS] [CrossRef] [Google Scholar]
- Strandet, M. L., Weiss, A., Vieira, J. D., et al. 2016, ApJ, 822, 80 [NASA ADS] [CrossRef] [Google Scholar]
- Uzawa, Y., Fujii, Y., Gonzalez, A., et al. 2013, Phys. C Supercond., 494, 189 [Google Scholar]
- Vallini, L., Gallerani, S., Ferrara, A., Pallottini, A., & Yue, B. 2015, ApJ, 813, 36 [NASA ADS] [CrossRef] [Google Scholar]
- Vallini, L., Ferrara, A., Pallottini, A., & Gallerani, S. 2017, MNRAS, 467, 1300 [NASA ADS] [Google Scholar]
- Vieira, J. D., Crawford, T. M., Switzer, E. R., et al. 2010, ApJ, 719, 763 [NASA ADS] [CrossRef] [Google Scholar]
- Vishwas, A., Ferkinhoff, C., Nikola, T., et al. 2018, ApJ, 856, 174 [NASA ADS] [CrossRef] [Google Scholar]
- Vito, F., Brandt, W. N., Comastri, A., et al. 2024, A&A, 689, A130 [NASA ADS] [CrossRef] [EDP Sciences] [Google Scholar]
- Zhou, D., Chapman, S. C., Sulzenauer, N., et al. 2025, ApJ, 982, L17 [Google Scholar]
Appendix A: ALMA band 6 and 10 continuum
The band 10 ALMA receiver is a dual-sideband receiver that requires 90 degrees Walsh switching to split the sidebands and corresponding spectral windows in order to maximize the continuum bandwidth to ∼ 8 GHz (Maud et al. 2022, 2023). This dataset was observed using the band-to-band calibration method of observing a differential gain calibrator at a lower frequency than the high frequency tuning in order to scale the higher signal-to-noise solutions to higher frequencies before eventually applying to the target source (Asaki et al. 2020a,b, 2023; Maud et al. 2020, 2022, 2023). The array configuration for band 10 reaches a field of view of ∼7", maximum recoverable scale of ∼3.2" and synthesized beam θ∼0.19" with Briggs weighting and a robust parameter of 0.5. For the archival ALMA band 6 data, the synthesised beam (with Briggs robust weighting factor = 0.5) is θ ∼ 0.45". The field of view is 25", with a maximum recoverable scale of ∼6.5".
 |
Fig. A.1. The ALMA band 10 continuum image of the Core region imaged beyond the primary beam of ∼7" to explore emission from bright sources (B10 synthesized beam (magenta) shown in the bottom left corner). The APEX measurement of the [O III] emission line comes from the cyan circle. Black contours show the band 6 dust continuum detections at signal-to-noise ratio levels of -3,3,6,10,15. |
ALMA Band 10 continuum detections
Appendix B: Novel APEX observations compared with LABOCA sub-mm maps
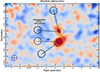 |
Fig. B.1. Representative ’off’ positions (black circles) are shown for the APEX/SEPIA observations of the Core and North (orange circles), overlaid on LABOCA submm continuum emission (magenta beam shown in bottom left). |
APEX spectral line pointed observations used wobbler switching, which only chops in Azumith, with a 1.5 Hz rate and offset of 50". Each scan consisted of a hot/sky/cold calibration, followed by up to 10 subscans of 20 s per on-source integration time. Wobbler-switching spectral line focus observations were performed every 2-4 hr and pointing checks every 1-3 hr, depending on frequency, using planets (Mars, Saturn) or standard APEX calibrators (e.g. ‘pi1-Gru’, ‘R-Dor’, ‘IRAS15194-5115’). The central position for the wobbler-switching is set to an amplitude of 50", which results in an off position that is 100" from the target, as shown in the Fig B.1. A representative set of ’off’ positions is shown for the APEX/SEPIA observations with respect to APEX LABOCA submm continuum maps (Hill et al. 2020).
Our result independently verifies the APEX total power measurements first reported by Strandet et al. (2016), and recently highlighted by Zhou et al. (2025) in the context of excess CO(4-3) emission. We note that the pointing in Strandet et al. (2016) was identical as ours, and still agrees with our novel measurements of the Core using SEPIA345 with better receiver baseline stability. This consistency between measurements remains despite using a completely different instrument (i.e. the decommissioned FLASH instrument (Klein et al. 2014), with the observations in Strandet et al. (2016) having taken place before the complete refurbishment of the primary mirror for APEX in 2017.
If we consider the global dust emitting region, previous LABOCA measurements had measured more 870 μm flux density than reported with ALMA (Miller et al. 2018; Hill et al. 2020). The elongated structure that extends to the North is where we find a relative excess of 4× amount of [C II] emitting gas compared to the one galaxy, yet extended dust from LABOCA is likely diffuse, warm and optically thin. We therefore consider dust attenuation of the [O III] line from any large-scale dust emission to be negligible. Still, this suggests there could be additional line emission that are resolved out by interferometers like ALMA.
All Tables
All Figures
|
Fig. 1. ALMA Band 6 dust continuum emission from SPT2349-56, showing the core region (top left) and the north extension (top right) 45″ away. The pointing centre and instrument FWHM of APEX SEPIA345 (orange) and SEPIA660 (cyan) observations are overlaid. The Band 6 synthesised beam (magenta) is shown in the bottom-left of each panel. The black contours indicate ALMA Band 10 dust continuum detections towards the core region at signal-to-noise ratio levels of 3, 6, 10, and 15. Several continuum sources are labelled, as identified by Hill et al. (2020). Bottom left: The [C II] (orange; δV = 110 km s−1) and [O III] 88 μm (cyan; δV = 140 km s−1) spectra (Flux density vs. velocity, corrected using z = 4.304). Bottom right: The [C II] spectra (flux density or antenna temperature vs. frequency) shown for both observations of the core (orange; δV = 100 km s−1) and north (fuchsia; δV = 100 km s−1) fields. |
| In the text | |
|
Fig. A.1. The ALMA band 10 continuum image of the Core region imaged beyond the primary beam of ∼7" to explore emission from bright sources (B10 synthesized beam (magenta) shown in the bottom left corner). The APEX measurement of the [O III] emission line comes from the cyan circle. Black contours show the band 6 dust continuum detections at signal-to-noise ratio levels of -3,3,6,10,15. |
| In the text | |
|
Fig. B.1. Representative ’off’ positions (black circles) are shown for the APEX/SEPIA observations of the Core and North (orange circles), overlaid on LABOCA submm continuum emission (magenta beam shown in bottom left). |
| In the text | |
Current usage metrics show cumulative count of Article Views (full-text article views including HTML views, PDF and ePub downloads, according to the available data) and Abstracts Views on Vision4Press platform.
Data correspond to usage on the plateform after 2015. The current usage metrics is available 48-96 hours after online publication and is updated daily on week days.
Initial download of the metrics may take a while.