Fig. 10
Download original image
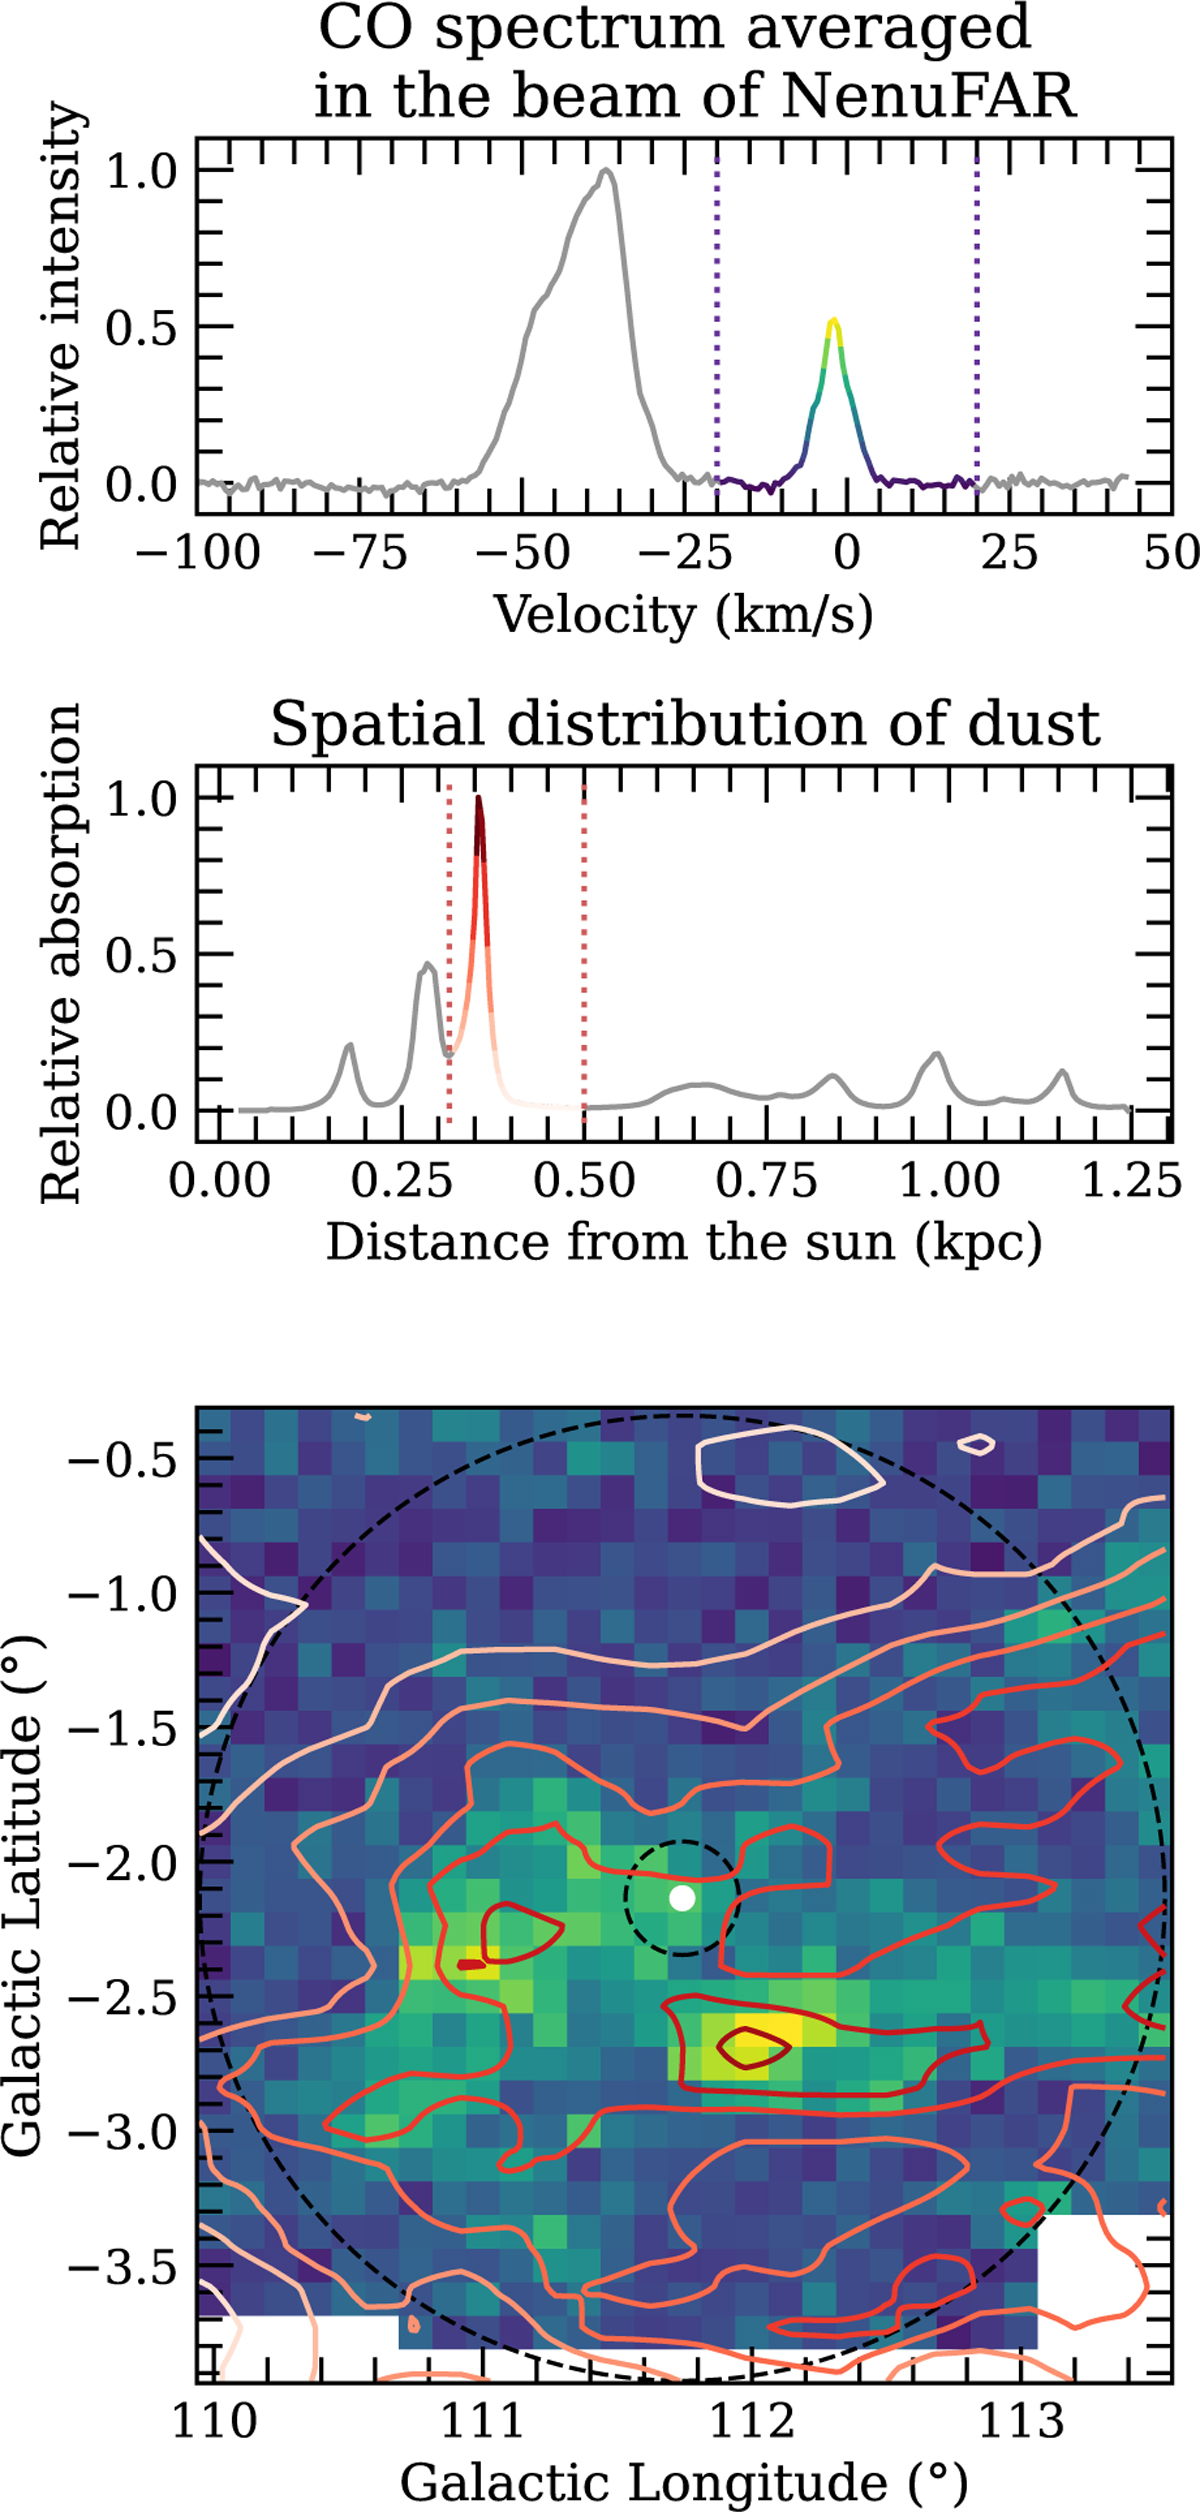
Cloud identification for the 0 km s −1 component of Cas A. Top panel: CO spectrum averaged over the largest beam of NenuFAR. The gray line represents the whole spectrum. The coloured part is the sliced used to draw the intensity map in the bottom panel (see Dame et al. 2001). Middle panel: dust distribution along the sightline of Cas A (see Edenhofer et al. 2024). The gray line represents the sightline up to a distance of 1.25 kpc. The coloured part is the slice used to plot the contours in the bottom panel. Bottom panel: overplot of the intensity of CO and dust absorption in the plane of sky. The colour map is the 0th moment of the CO cube limited to velocities between −20 and 20 km s−1. The contours are the absorption of the dust located between 0.3 and 0.5 kpc from the Sun. The white filled circle represents the position and size of Cas A. The black dashed circles are the largest and smallest beams of NenuFAR (respectively 3.59° and 24.4′).
Current usage metrics show cumulative count of Article Views (full-text article views including HTML views, PDF and ePub downloads, according to the available data) and Abstracts Views on Vision4Press platform.
Data correspond to usage on the plateform after 2015. The current usage metrics is available 48-96 hours after online publication and is updated daily on week days.
Initial download of the metrics may take a while.