Fig. 12
Download original image
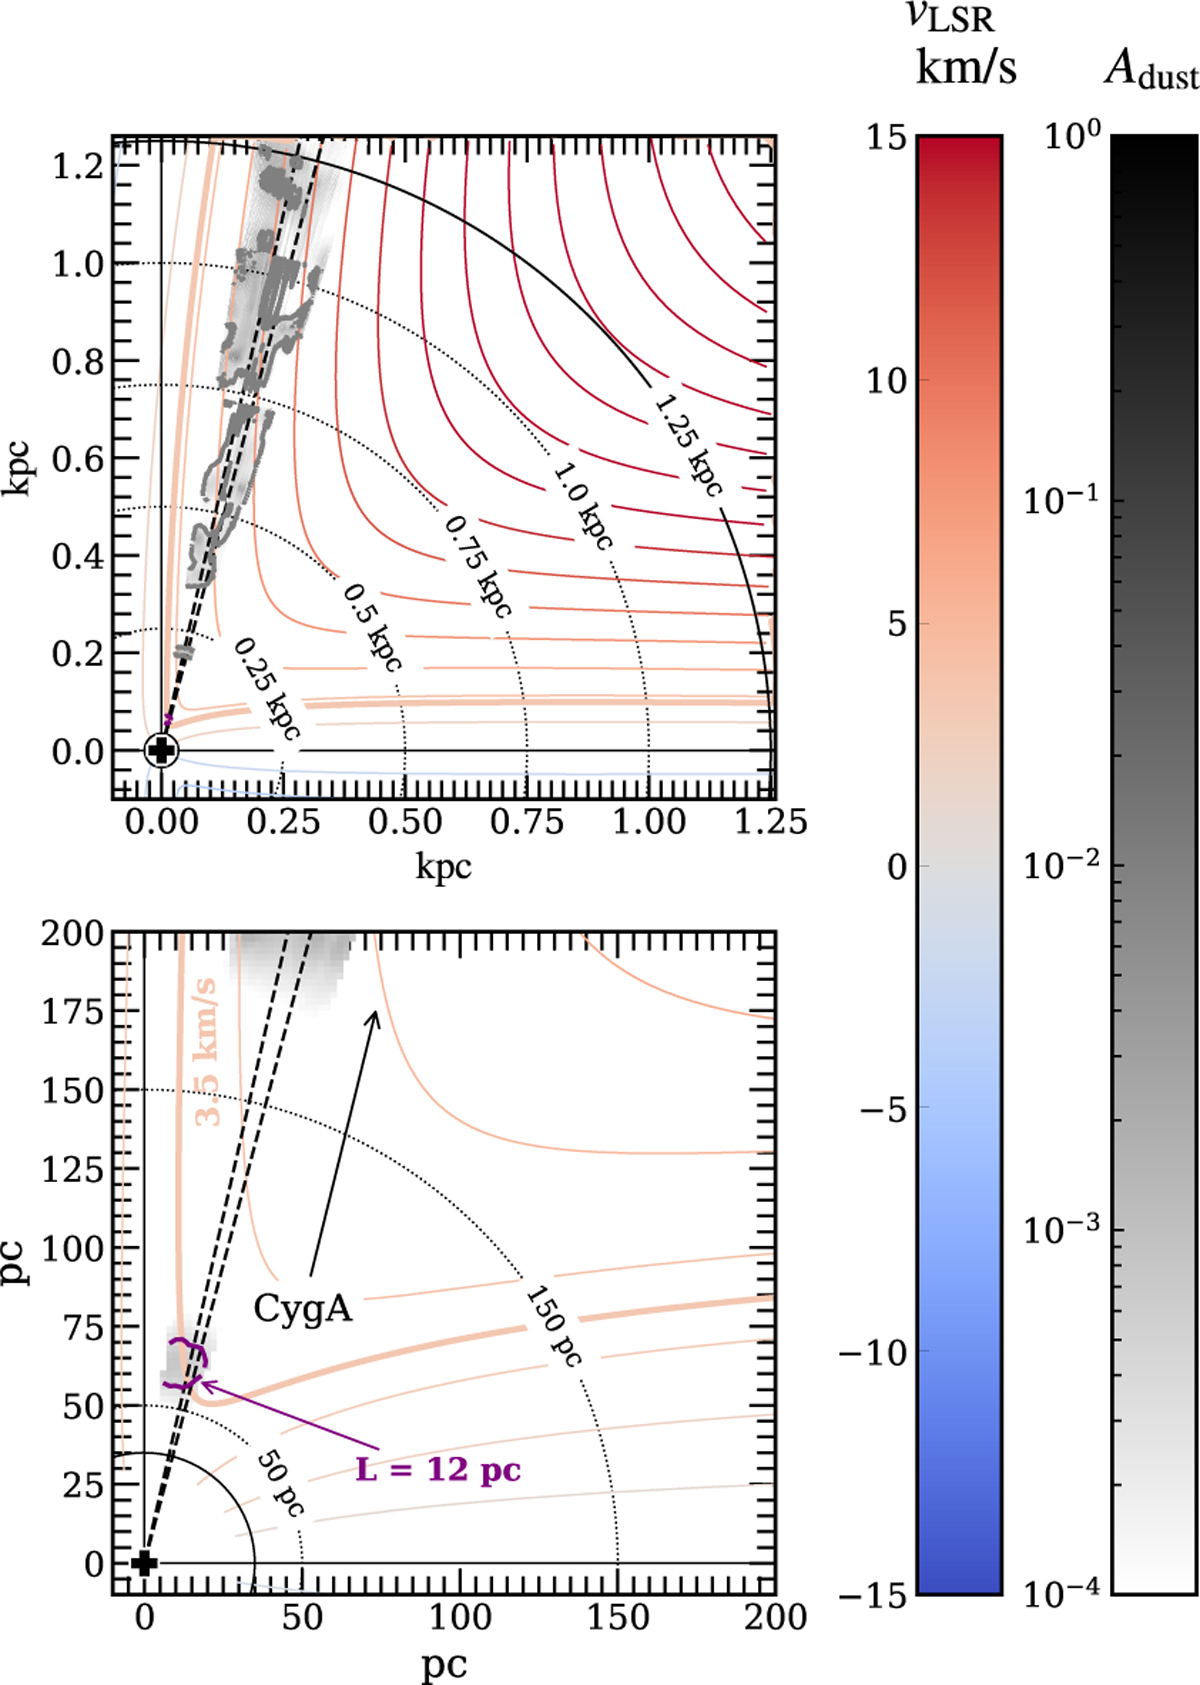
Cloud identification for the 3.5 km s−1 component towards Cyg A. Both panels are an overplot of the dust distribution in gray (Edenhofer et al. 2024) and theoretical LSR velocities in blue and red contours (Reid et al. 2019). The largest beam of NenuFAR is marked in black dotted lines. The Sun is represented by the black cross. Top panel: overview of the sightline up to 1.25 kpc from the Sun. The gray contours correspond to the most prominent clouds in the beam of NenuFAR. Bottom panel: zoom on the close vicinity, up to 200 pc from the Sun. The purple cloud crosses the beam towards Cyg A at the expected velocity of 3.5 km s−1.
Current usage metrics show cumulative count of Article Views (full-text article views including HTML views, PDF and ePub downloads, according to the available data) and Abstracts Views on Vision4Press platform.
Data correspond to usage on the plateform after 2015. The current usage metrics is available 48-96 hours after online publication and is updated daily on week days.
Initial download of the metrics may take a while.