Fig. 13
Download original image
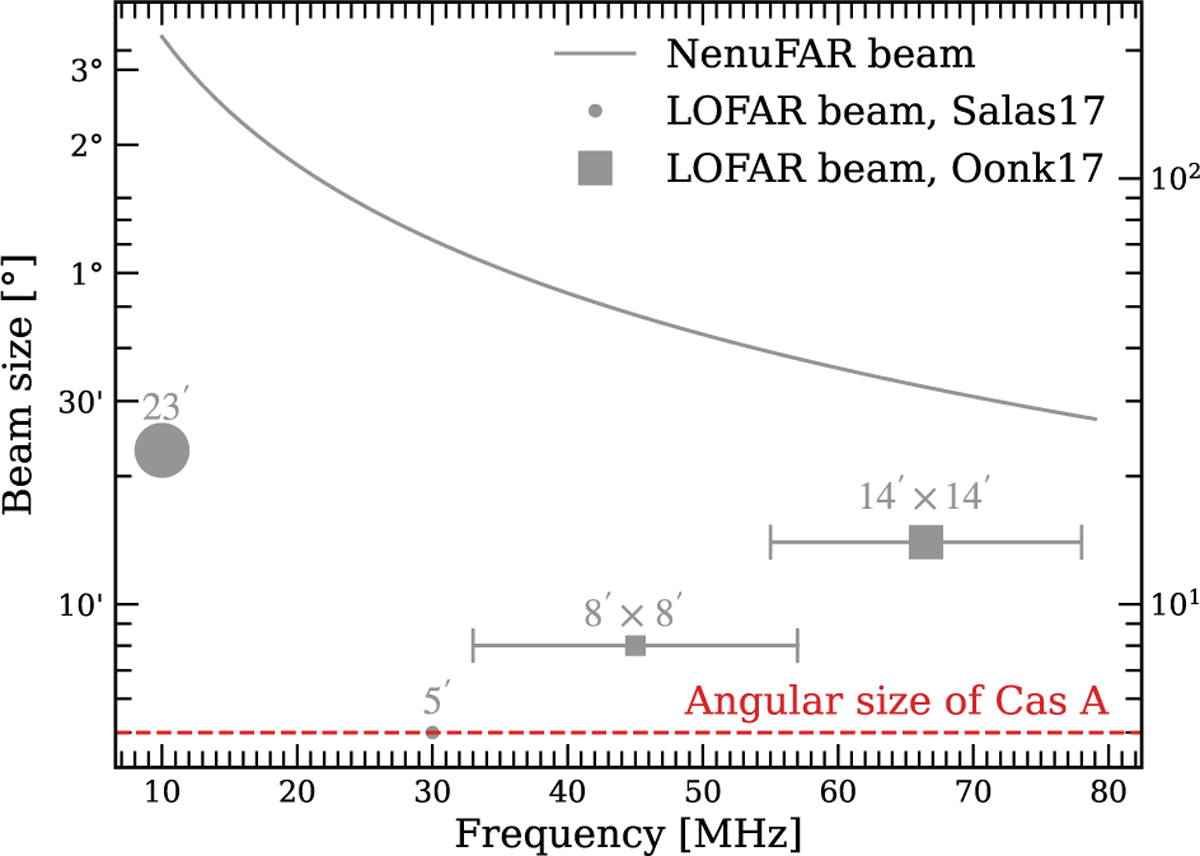
Frequency dependence of beam sizes for NenuFAR and LOFAR, shown alongside the angular size of Cas A. The LOFAR beam is represented for the two CRRLs experiment: Salas et al. (2017) (circles) and Oonk et al. (2017) (squares). Oonk et al. (2017) cropped the images from LOFAR in squares whose sizes are fixed in two frequency windows. Salas et al. (2017) cropped the images from LOFAR in circles centred on Cas A, with continuous values for its diameter. The Nenu-FAR beam size function is shown with the solid line. The red dotted line represents the angular extension of Cas A at radio frequencies (Green 2014). The source is spatially resolved for neither setups, at any frequency.
Current usage metrics show cumulative count of Article Views (full-text article views including HTML views, PDF and ePub downloads, according to the available data) and Abstracts Views on Vision4Press platform.
Data correspond to usage on the plateform after 2015. The current usage metrics is available 48-96 hours after online publication and is updated daily on week days.
Initial download of the metrics may take a while.