Fig. 14
Download original image
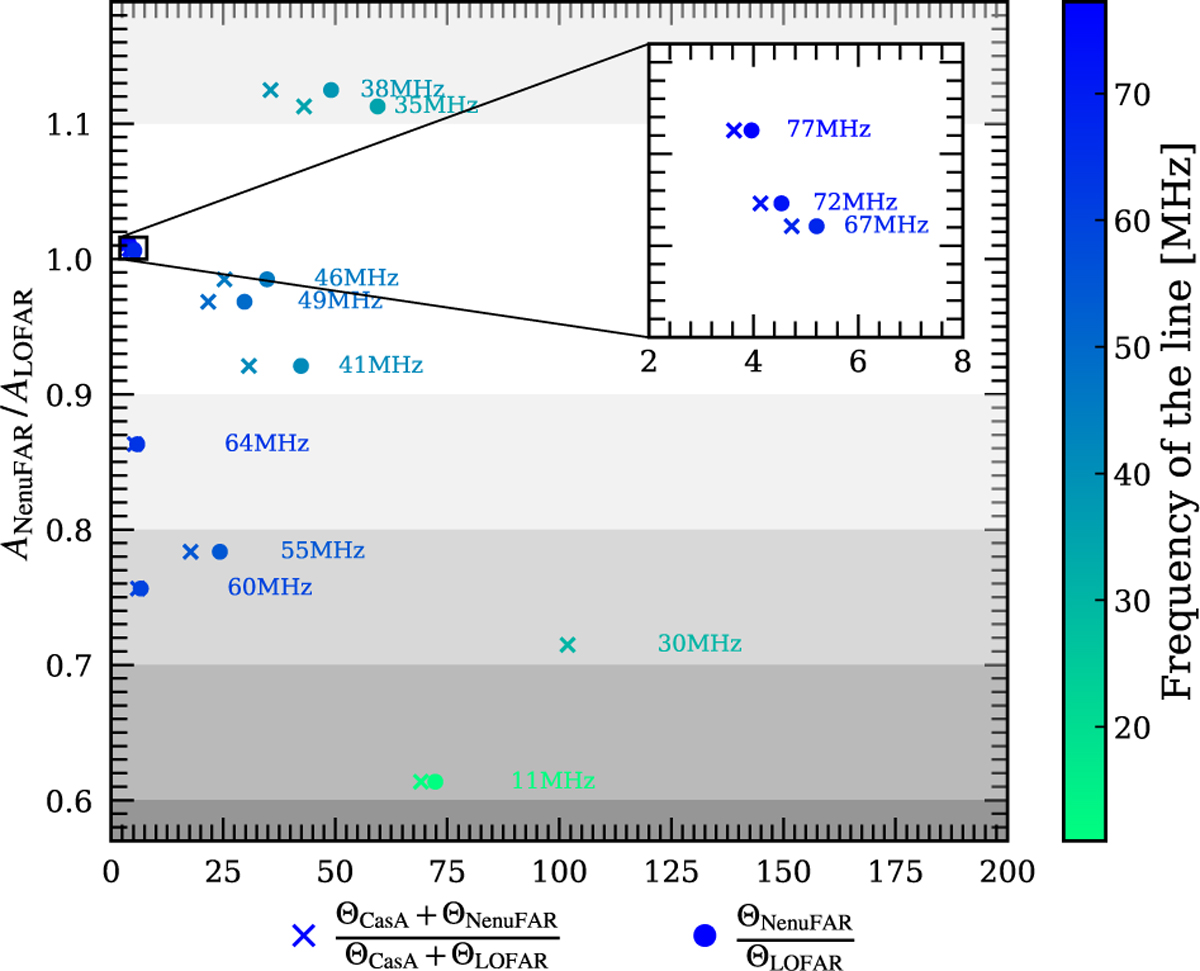
Ratio of the line intensities towards Cas A between observations with NenuFAR and with LOFAR as a function of beam ratio. The crosses represent the filling factor ratios for Cas A and the dots represent the ratio of angular resolutions for the two experiments. If at a given frequency a dot and a cross are close to each other, then the filling factors are similar for both instruments, meaning a less prominent dilution effect between both experiments. The colour scale indicates the central frequency of the lines. The ratio of the line intensities follows the tendency of being farther from one at lower frequencies. The differences in filling factor follow the same tendency.
Current usage metrics show cumulative count of Article Views (full-text article views including HTML views, PDF and ePub downloads, according to the available data) and Abstracts Views on Vision4Press platform.
Data correspond to usage on the plateform after 2015. The current usage metrics is available 48-96 hours after online publication and is updated daily on week days.
Initial download of the metrics may take a while.