Fig. 16
Download original image
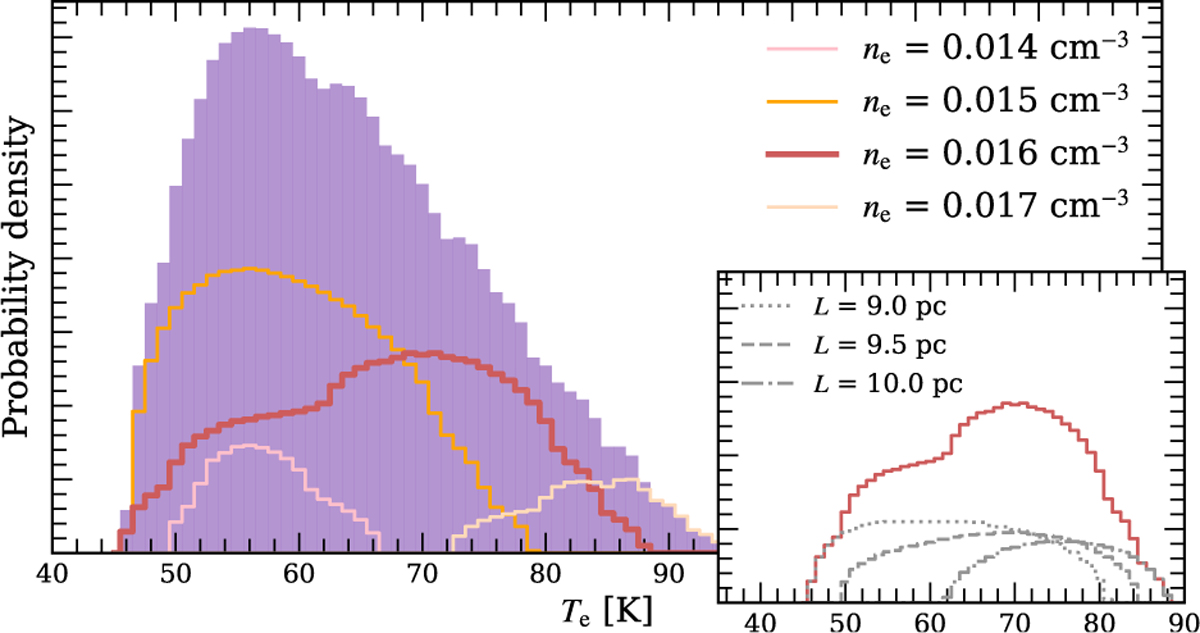
Illustration of the influence of the parameters ne and L on the optimal value found for Te, for Cygnus A. The purple histogram represents all the values of Te that give ![]() . The coloured curves represents the values of Tethat verify the condition while ne is fixed at a given value. The snapshot on the right panel is a focus on the curve with ne = 0.016 cm−3. The gray curves represent the values of Te that verify
. The coloured curves represents the values of Tethat verify the condition while ne is fixed at a given value. The snapshot on the right panel is a focus on the curve with ne = 0.016 cm−3. The gray curves represent the values of Te that verify ![]() while L is fixed at given values.
while L is fixed at given values.
Current usage metrics show cumulative count of Article Views (full-text article views including HTML views, PDF and ePub downloads, according to the available data) and Abstracts Views on Vision4Press platform.
Data correspond to usage on the plateform after 2015. The current usage metrics is available 48-96 hours after online publication and is updated daily on week days.
Initial download of the metrics may take a while.