Fig. D.1
Download original image
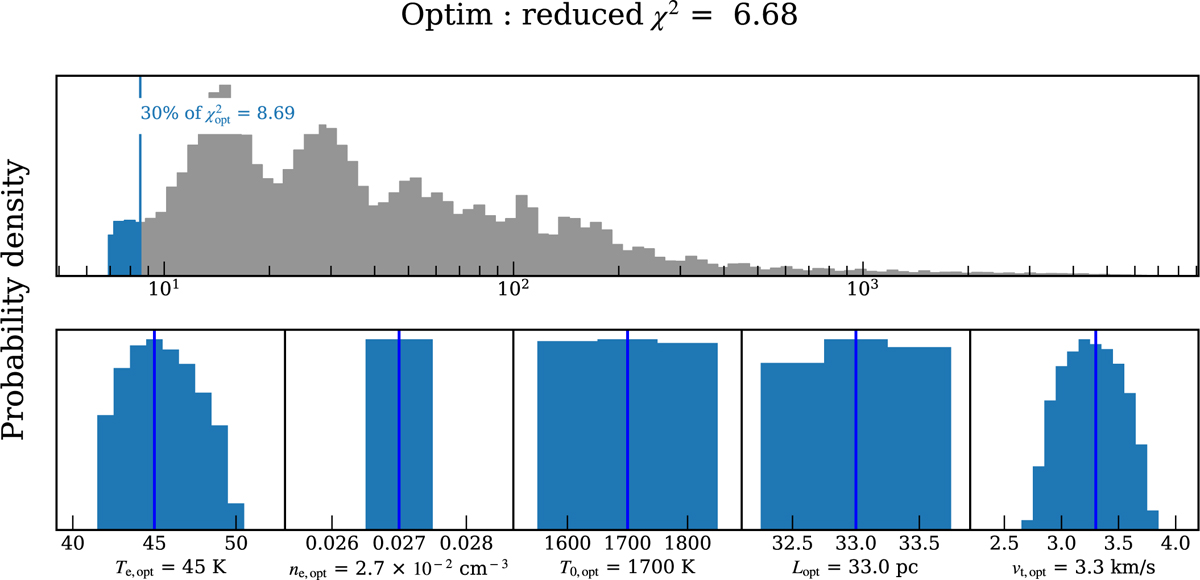
Summary of the grid search for Cassiopeia A, component −47 km s−1. The top panel is the histogram of all the nodes of the final grid. The blue part of the histogram highlights the 30% of χ2 that are kept to evaluate the uncertainties. The bottom panels represent for each parameter the values that gives a χ2 distance comprised in the 30% range.
Current usage metrics show cumulative count of Article Views (full-text article views including HTML views, PDF and ePub downloads, according to the available data) and Abstracts Views on Vision4Press platform.
Data correspond to usage on the plateform after 2015. The current usage metrics is available 48-96 hours after online publication and is updated daily on week days.
Initial download of the metrics may take a while.