Fig. 2
Download original image
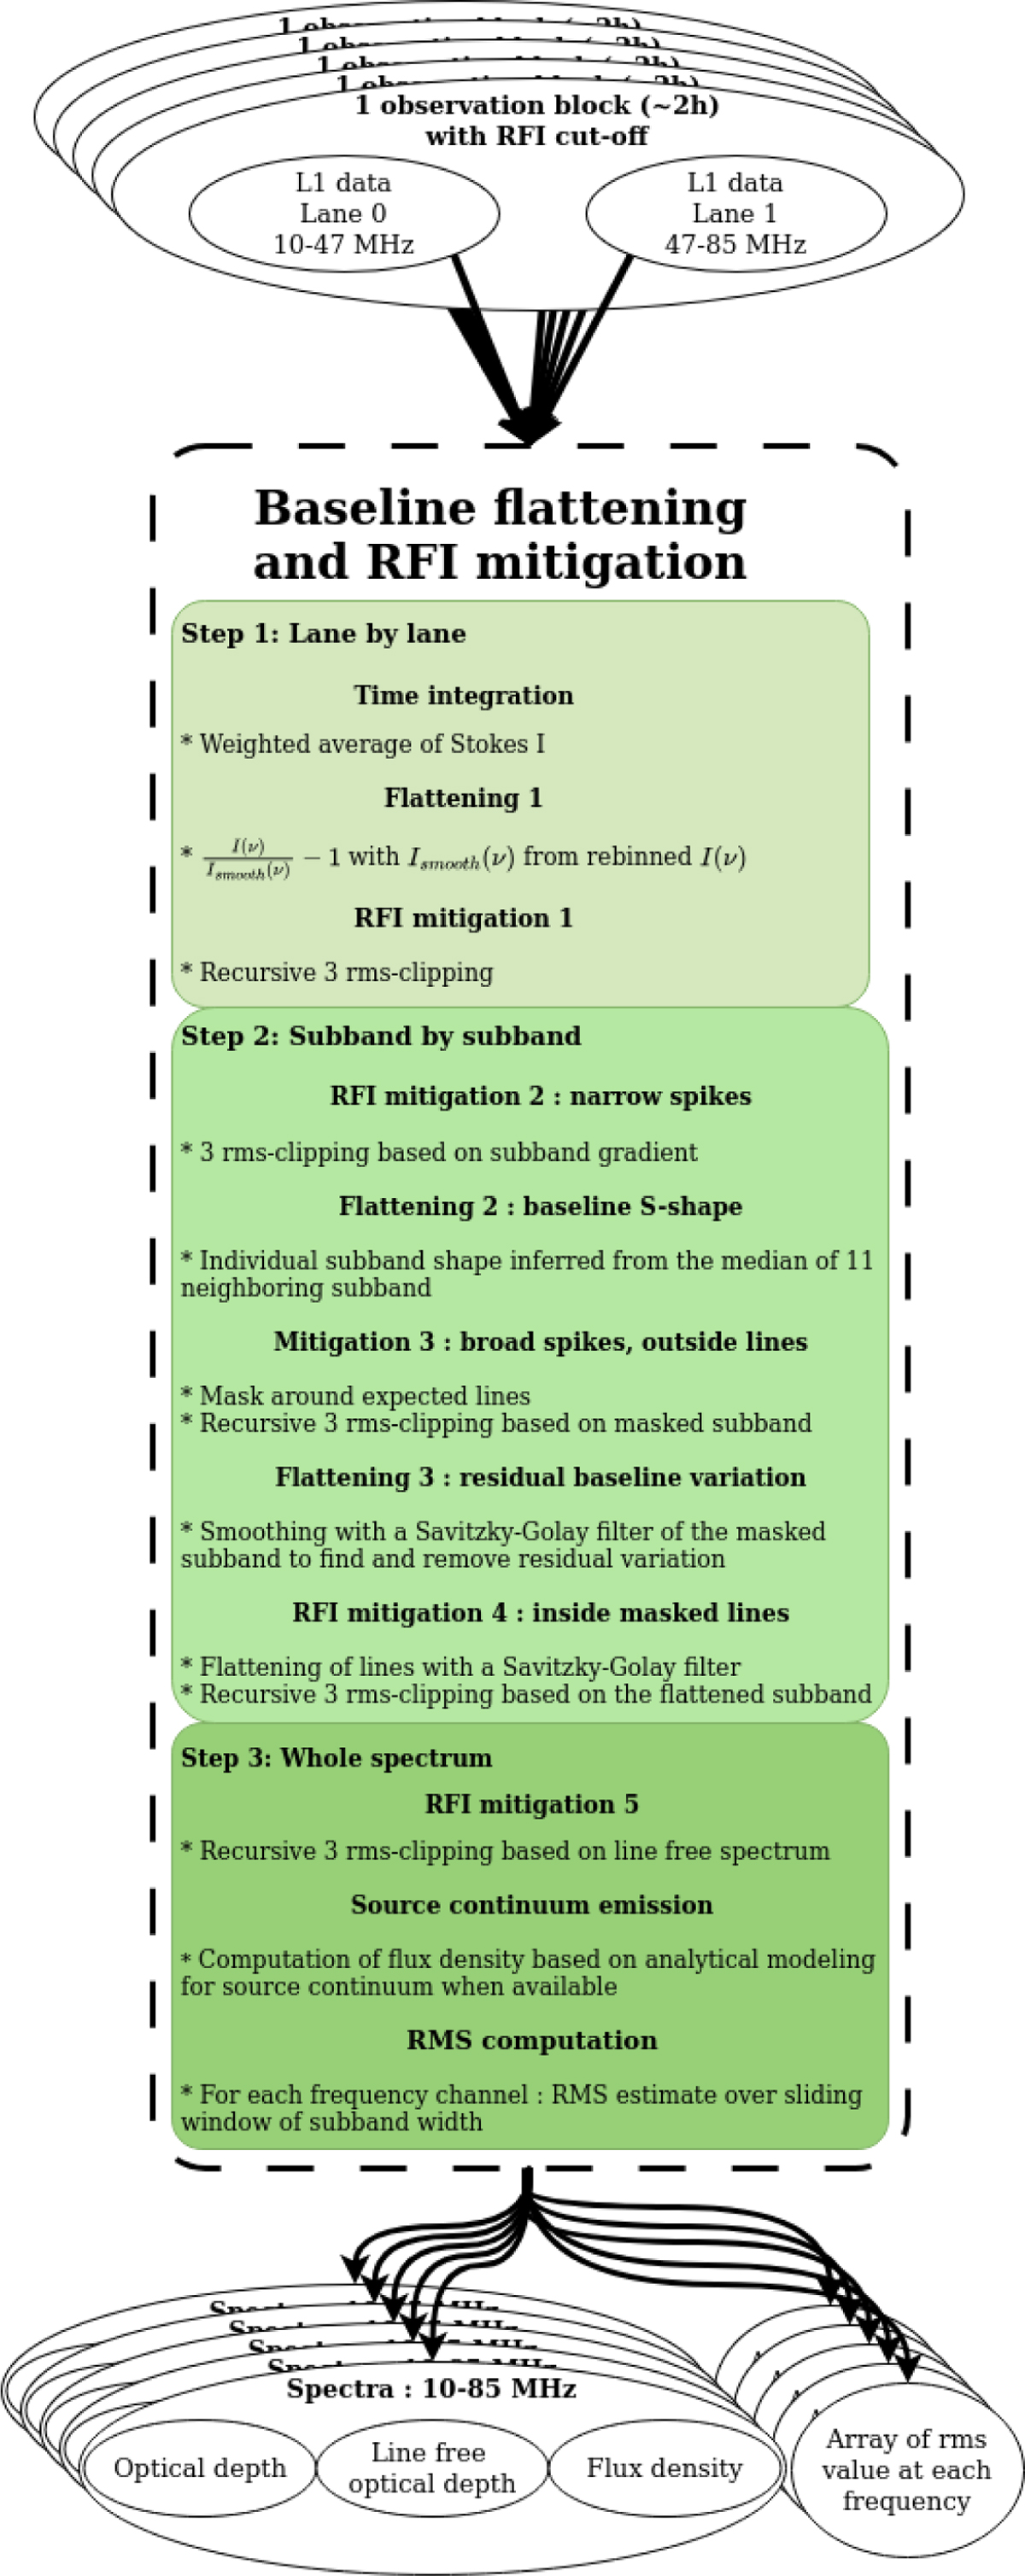
Functional diagram for the processing of L1 level data (see Sect. 3.1). The algorithm is split in three reduction layers: lane-by-lane (top, 2a, Sect. 3.1.1), sub-band-by-sub-band (middle part, 2b, Sect. 3.1.2) and whole spectrum (bottom, 2c, Sect. 3.1.3). The processing consists of an iterative series of RFI mitigation and baseline flattening steps, followed by its application to real data illustrated in Fig. 3.
Current usage metrics show cumulative count of Article Views (full-text article views including HTML views, PDF and ePub downloads, according to the available data) and Abstracts Views on Vision4Press platform.
Data correspond to usage on the plateform after 2015. The current usage metrics is available 48-96 hours after online publication and is updated daily on week days.
Initial download of the metrics may take a while.