Fig. 3
Download original image
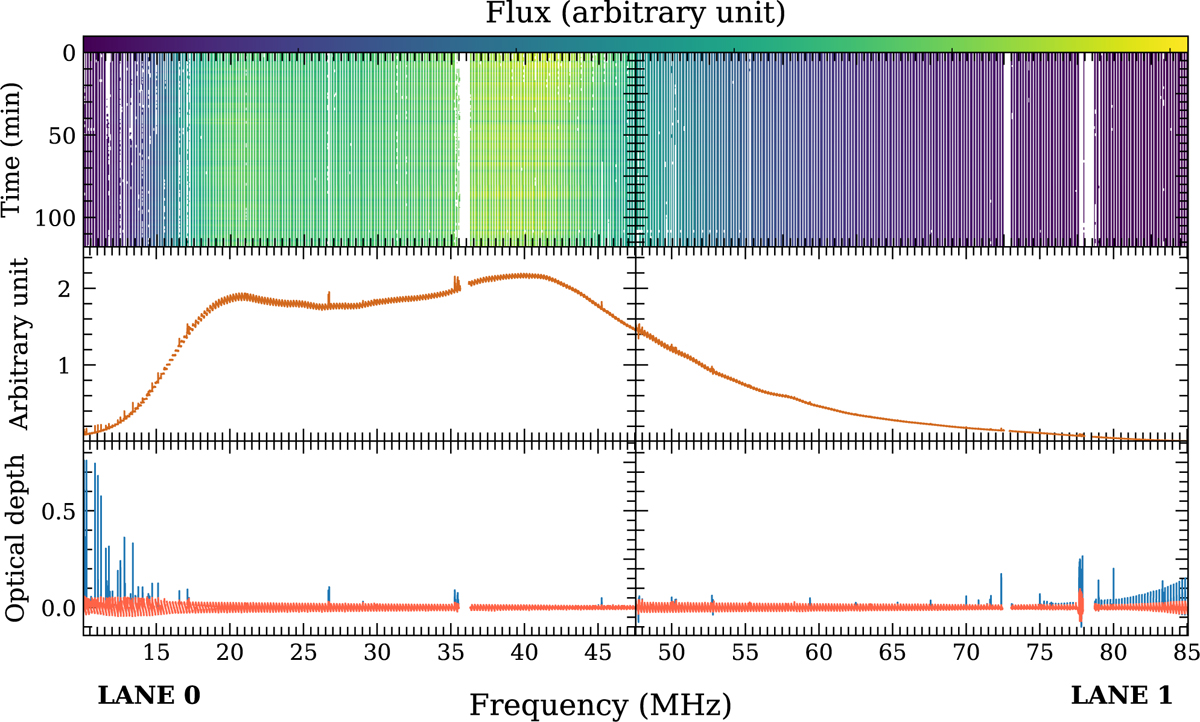
Description of the step 1 of the data processing algorithm (see top part of Fig. 2). The top panel represents the time-frequency table, I(nt, nυ), issued by the pre-processing algorithm read_nu_spec. Middle panel shows the spectrum integrated over the two hours of observations, in arbitrary units. Bottom panel shows the flattened spectrum before (blue) and after (red) 3 rms clipping.
Current usage metrics show cumulative count of Article Views (full-text article views including HTML views, PDF and ePub downloads, according to the available data) and Abstracts Views on Vision4Press platform.
Data correspond to usage on the plateform after 2015. The current usage metrics is available 48-96 hours after online publication and is updated daily on week days.
Initial download of the metrics may take a while.