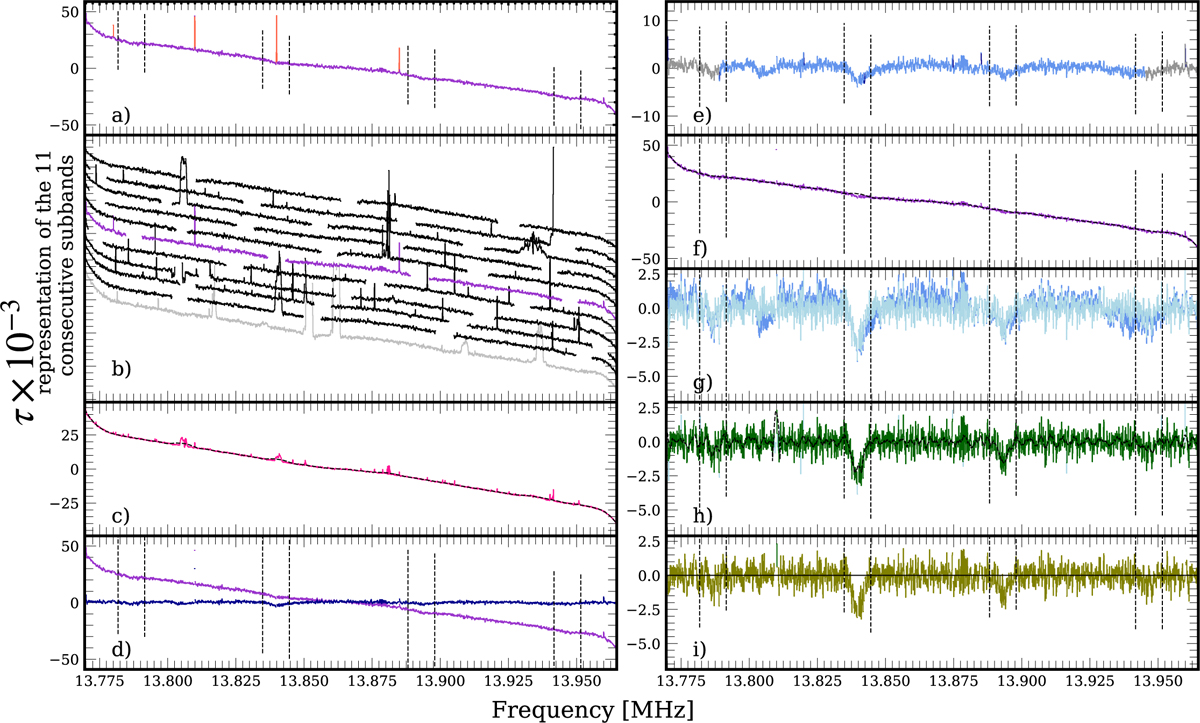
Fig. 4
Download original image
Description of step 2 of the data processing algorithm (see middle part of Fig. 2). The data presented here correspond to the 19th sub-band of the data set presented in Fig. 3. The black dotted lines represent the mask around the expected lines. The different colours represent the sub-band at each step of the processing (described in the middle part of Fig. 2). (a) The red (resp. purple) spectrum is before (resp. after) the ‘RFI mitigation 2’ step. (b) The purple spectrum is the sub-band being processed, the black spectra are the neighbouring sub-bands used to assess the general shape. The gray sub-band has been discarded. (c) The pink line is the median of the black and purple sub-band in panel (b), and the black dotted line is the median smoothed by a Savitzky–Golay filter. (d) The purple (resp. navy blue) spectrum is before (resp. after) the ‘flattening 2’ step. (e) The navy blue (resp. azure blue) spectrum is before (resp. after) the ‘RFI mitigation 3’ step. In this case, RFI was removed at 13.92 and 13.96 MHz. (g) The azure blue (resp. light blue) spectrum is before (resp. after) the ‘flattening 3’ step. The light blue (resp. green) spectrum is before (resp. after) the ‘RFI mitigation 4’ step, and the black dotted line is the green spectrum smoothed by a Savitzky–Golay filter. (i) Black line indicates the zero baseline and the olive green spectrum is the final flattened and cleaned sub-band.
Current usage metrics show cumulative count of Article Views (full-text article views including HTML views, PDF and ePub downloads, according to the available data) and Abstracts Views on Vision4Press platform.
Data correspond to usage on the plateform after 2015. The current usage metrics is available 48-96 hours after online publication and is updated daily on week days.
Initial download of the metrics may take a while.